Last:
Last: 
Here is the daily technical analysis for September 8, 2023. The data and analysis in this bulletin can be broadly utilized for your trading. However, it is important to note that GICTrade and the data providers are not responsible for your trading outcomes.
Thus, the responsibility lies with you. Before diving into today's technical analysis, make sure to register for the GIC Prize Bonanza and stand a chance to win the grand prize, a Mitsubishi Expander or a holiday package to Labuan Bajo for 4 days and 3 nights.
Below, we will provide forecasts for price movements in Forex and commodities, complete with calculations of pivot points, resistance, and support levels.
EURUSD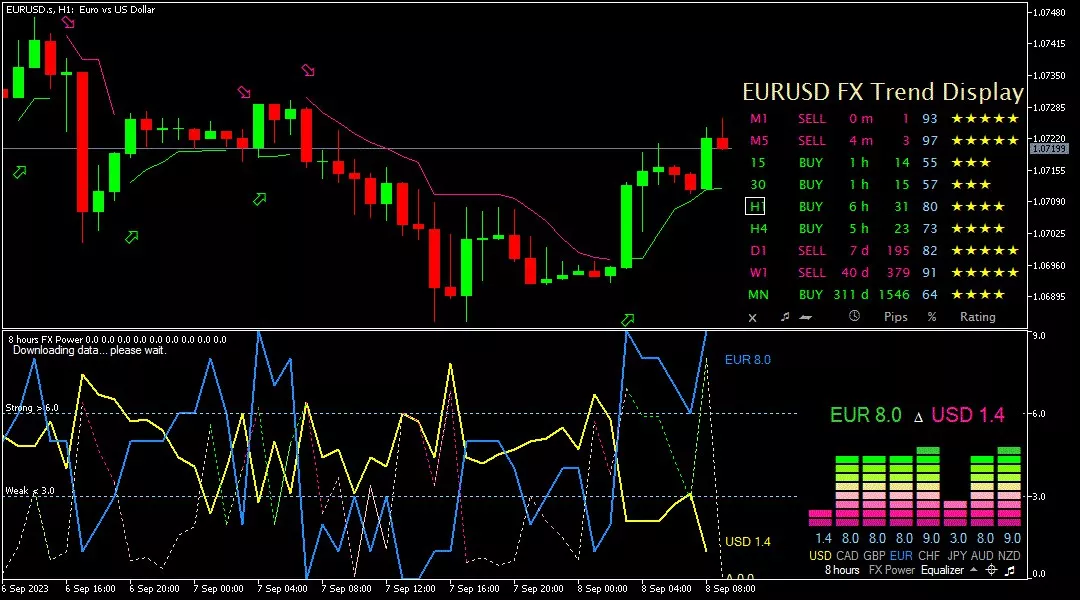
The EUR/USD pair in the 1-hour timeframe is attempting to move higher, reaching a resistance level at 1.07320 and aiming for the next resistance level at 1.07540. The upward trend is also evident from the FXBot template, where the EUR figure is higher at 8.0 compared to the USD figure of 1.4. Additionally, the bullish bias is supported by the buy signal indicated by the green arrow.
Suggest: Sell 1.07320 TP1 1.07080 TP2 1.06860 SL 1.07540
|
PREVIOUS RANGE |
||||||
|
OPEN |
HIGH |
LOW |
CLOSE |
PREV.CLOSE |
CHANGE |
%CHANGE |
|
1.07239 |
1.07299 |
1.06844 |
1.06939 |
1.07242 |
-0.00303 |
-0.28% |
|
DAILY PIVOT POINT |
||||||
|
R3 |
R2 |
R1 |
PIVOT |
S1 |
S2 |
S3 |
|
1.07770 |
1.07540 |
1.07320 |
1.07080 |
1.06860 |
1.06630 |
1.06410 |
GBPUSD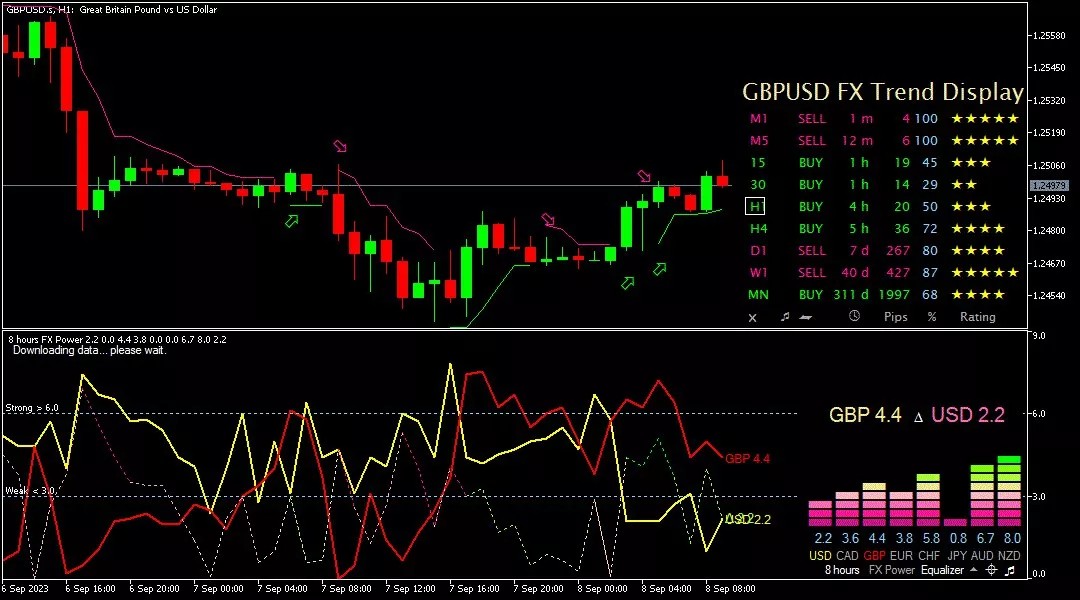
The GBP/USD pair in the 1-hour timeframe is attempting to move higher, reaching a resistance level at 1.25180 and aiming for the next resistance level at 1.25440. The upward trend is also evident from the FXBot template, where the GBP figure is higher at 4.4 compared to the USD figure of 2.2. Additionally, the bullish bias is supported by the buy signal indicated by the green arrow.
Suggest: Sell 1.25180 TP1 1.24810 TP2 1.24560 SL 1.25440
|
PREVIOUS RANGE |
||||||
|
OPEN |
HIGH |
LOW |
CLOSE |
PREV.CLOSE |
CHANGE |
%CHANGE |
|
1.25043 |
1.25064 |
1.24438 |
1.24692 |
1.25046 |
-0.00354 |
-0.28% |
|
DAILY PIVOT POINT |
||||||
|
R3 |
R2 |
R1 |
PIVOT |
S1 |
S2 |
S3 |
|
1.25810 |
1.25440 |
1.25180 |
1.24810 |
1.24560 |
1.24180 |
1.23930 |
AUDUSD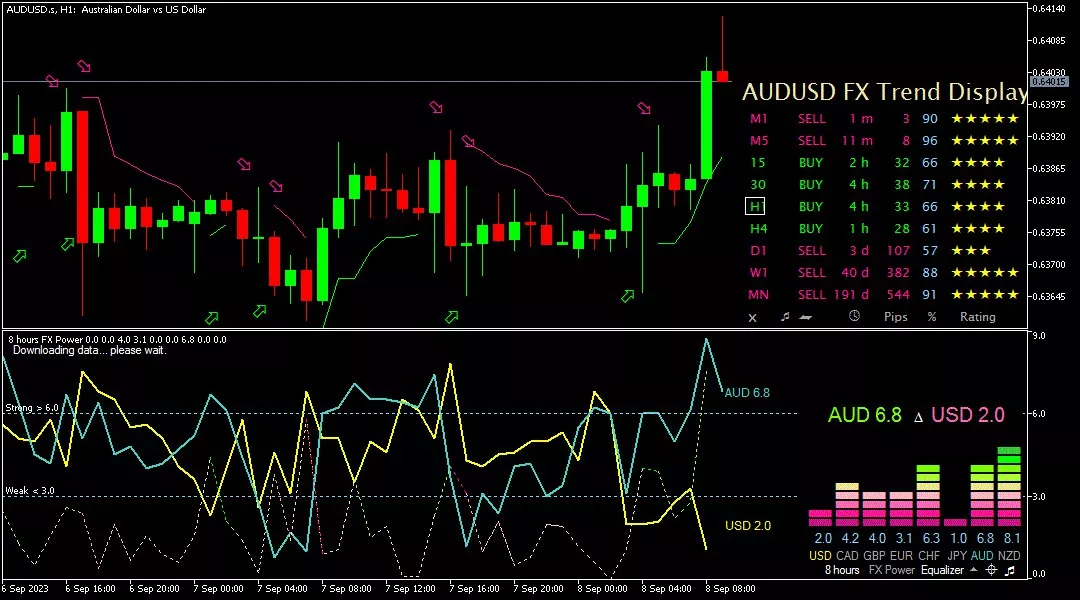
The AUD/USD pair in the 1-hour timeframe is attempting to move higher, reaching a resistance level at 0.64090 and targeting the next resistance level at 0.64240. The upward trend is supported by the FXBot template, where the AUD figure is higher at 6.8 compared to the USD figure of 2.0. However, the overall bias remains bearish, as indicated by the sell signal shown by the red arrow.
Suggest: Sell 0.64240 TP1 0.64000 TP2 0.63700 SL 0.64500
|
PREVIOUS RANGE |
||||||
|
OPEN |
HIGH |
LOW |
CLOSE |
PREV.CLOSE |
CHANGE |
%CHANGE |
|
0.63770 |
0.63930 |
0.63603 |
0.63737 |
0.63799 |
-0.00062 |
-0.09% |
|
DAILY PIVOT POINT |
||||||
|
R3 |
R2 |
R1 |
PIVOT |
S1 |
S2 |
S3 |
|
0.64240 |
0.64090 |
0.63920 |
0.63760 |
0.63590 |
0.63430 |
0.63260 |
USDCHF
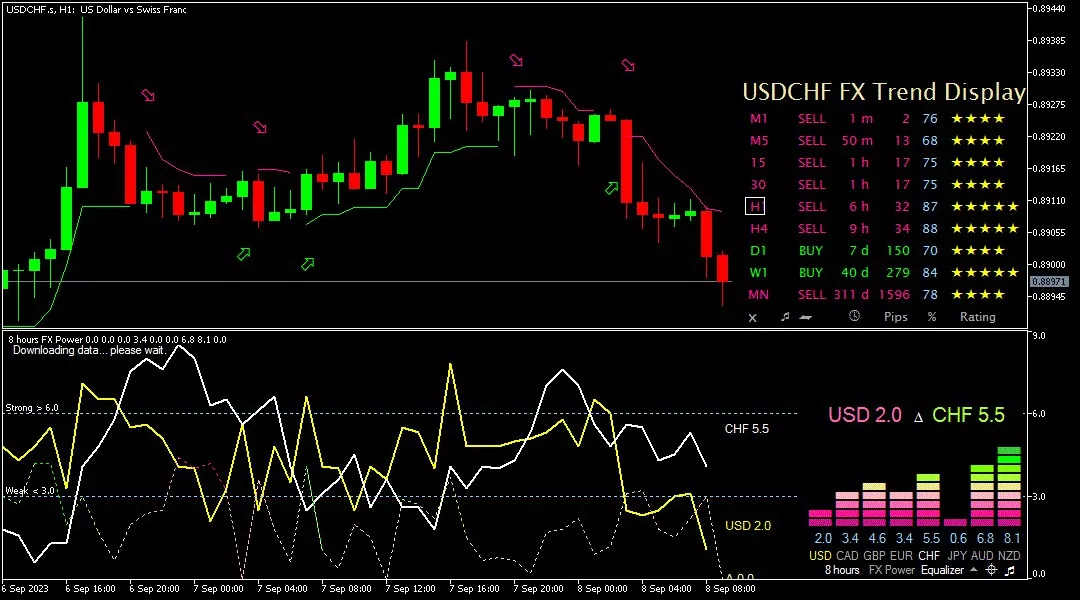
USD/CHF in the 1-hour timeframe is attempting to move down, touching the support level at 0.88880 and aiming for the next support level at 0.88700. The downward trend is also evident from the FXBot template, where the CHF figure is higher at 5.5 compared to the USD figure of 2.0. Meanwhile, the bearish bias is supported by the sell signal indicated by the red arrow.
Suggest: Buy 0.88880 TP1 0.89020 TP2 0.89200 SL 0.88600
|
PREVIOUS RANGE |
||||||
|
OPEN |
HIGH |
LOW |
CLOSE |
PREV.CLOSE |
CHANGE |
%CHANGE |
|
0.89086 |
0.89383 |
0.89064 |
0.89248 |
0.89086 |
0.00162 |
0.18% |
|
DAILY PIVOT POINT |
||||||
|
R3 |
R2 |
R1 |
PIVOT |
S1 |
S2 |
S3 |
|
0.89660 |
0.89520 |
0.89340 |
0.89200 |
0.89020 |
0.88880 |
0.88700 |
USDJPY
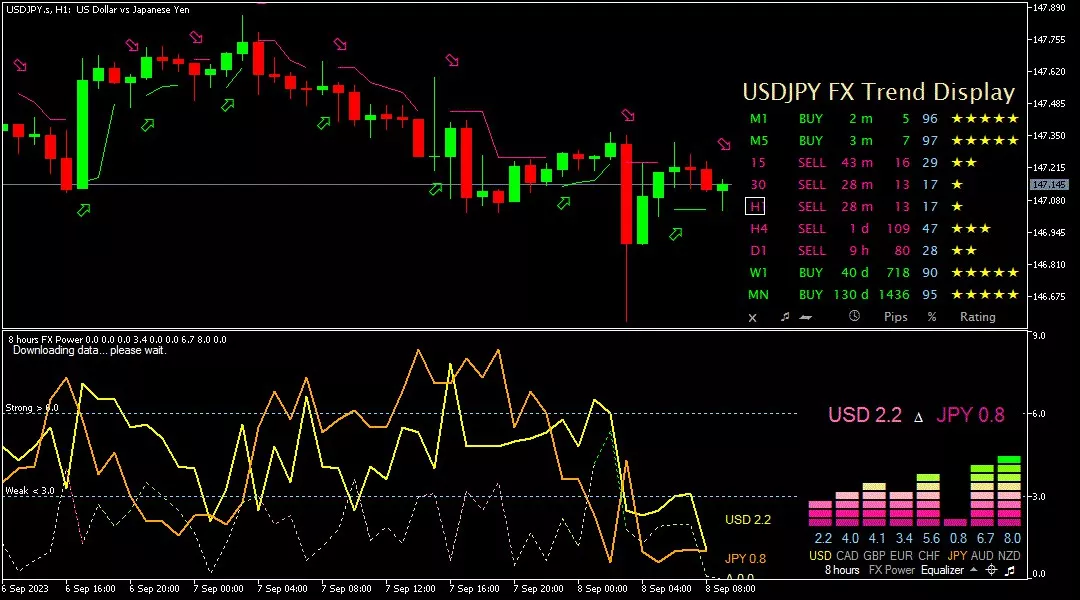
USD/JPY in the 1-hour timeframe is attempting to move down, touching the support level at 147.050 and heading toward the next support level at 146.620. However, the downward trend is not supported by the FXBot template, where the JPY figure is lower at 0.8 compared to the USD figure of 2.2. Meanwhile, the bearish bias is reinforced by the sell signal indicated by the red arrow.
Suggest: Buy 147.050 TP1 147.450 TP2 147.870 SL 146.700
|
PREVIOUS RANGE |
||||||
|
OPEN |
HIGH |
LOW |
CLOSE |
PREV.CLOSE |
CHANGE |
%CHANGE |
|
147.655 |
147.854 |
147.026 |
147.274 |
147.655 |
-0.381 |
-0.26% |
|
DAILY PIVOT POINT |
||||||
|
R3 |
R2 |
R1 |
PIVOT |
S1 |
S2 |
S3 |
|
148.700 |
148.280 |
147.870 |
147.450 |
147.050 |
146.620 |
146.220 |
XUL (LOCO LONDON GOLD)
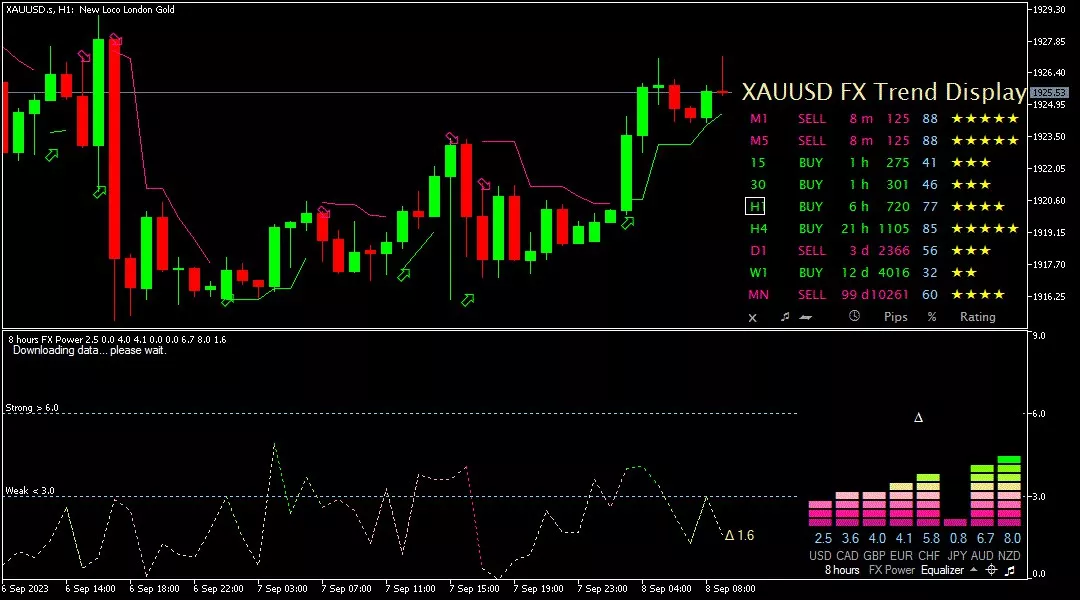
In the 1-hour timeframe, gold prices are attempting to rise, reaching the resistance level at 1928.80 and moving towards the next resistance level at 1934.00. Meanwhile, the bullish bias is supported by the buy signal indicated by the green arrow.
Suggest: Sell 1928.80 TP1 1924.00 TP2 1918.80 SL 1934.00
|
PREVIOUS RANGE |
||||||
|
OPEN |
HIGH |
LOW |
CLOSE |
PREV.CLOSE |
CHANGE |
%CHANGE |
|
1916.17 |
1923.44 |
1916.11 |
1919.44 |
1916.69 |
2.75 |
0.14% |
|
DAILY PIVOT POINT |
||||||
|
R3 |
R2 |
R1 |
PIVOT |
S1 |
S2 |
S3 |
|
1928.80 |
1926.10 |
1921.50 |
1918.80 |
1914.20 |
1911.50 |
1906.80 |
CLSK (OIL).webp)
In the 1-hour timeframe, oil prices are attempting to move down and need to break through the support level at 85.92 to reach the next support level at 84.88. For further bullish bias, oil prices must surpass the resistance level at 87.02 to advance to the next resistance level at 88.31.
Suggest: Sell 86.60 TP1 86.22 TP2 85.63 SL 87.00
|
PREVIOUS RANGE |
||||||
|
OPEN |
HIGH |
LOW |
CLOSE |
PREV.CLOSE |
CHANGE |
%CHANGE |
|
87.52 |
87.72 |
86.38 |
86.81 |
87.58 |
-0.77 |
-0.88% |
|
DAILY PIVOT POINT |
||||||
|
R3 |
R2 |
R1 |
PIVOT |
S1 |
S2 |
S3 |
|
88.90 |
88.31 |
87.56 |
86.97 |
86.22 |
85.63 |
84.88 |
Here's a summary of the analysis titled “Technical Daily Analysis: September 8, 2023 – US Jobless Claims Drop, Dollar Strengthens.” Also, check out our other articles, including guides on how to buy cryptocurrency, only at Jurnal GIC. Don’t forget to enhance your trading skills by getting the Scalping Ebook guide and participating in Live Trading at NFP Live Trading. Be sure to download the GIC Mobile App from the Google Play Store.