Last:
Last: 
EURUSD
.webp)
Suggest: Buy 1.04400 TP1 1.04620 TP2 1.05000 SL 1.04120
|
PREVIOUS RANGE |
||||||
|
OPEN |
HIGH |
LOW |
CLOSE |
PREV.CLOSE |
CHANGE |
%CHANGE |
|
1.05625 |
1.05899 |
1.04757 |
1.04757 |
1.05720 |
-0.00963 |
-0.91% |
|
DAILY PIVOT POINT |
||||||
|
R3 |
R2 |
R1 |
PIVOT |
S1 |
S2 |
S3 |
|
1.06910 |
1.06400 |
1.05760 |
1.05260 |
1.04620 |
1.04120 |
1.03480 |
GBPUSD
.webp)
Suggest: Buy 1.20350 TP1 1.20640 TP2 1.21000 SL 1.20070
|
PREVIOUS RANGE |
||||||
|
OPEN |
HIGH |
LOW |
CLOSE |
PREV.CLOSE |
CHANGE |
%CHANGE |
|
1.21780 |
1.22181 |
1.20845 |
1.20849 |
1.22017 |
-0.01168 |
-0.96% |
|
DAILY PIVOT POINT |
||||||
|
R3 |
R2 |
R1 |
PIVOT |
S1 |
S2 |
S3 |
|
1.23310 |
1.22750 |
1.21980 |
1.21410 |
1.20640 |
1.20070 |
1.19300 |
AUDUSD
.webp)
Suggest: Buy 0.63100 TP1 0.63490 TP2 0.63800 SL 0.62800
|
PREVIOUS RANGE |
||||||
|
OPEN |
HIGH |
LOW |
CLOSE |
PREV.CLOSE |
CHANGE |
%CHANGE |
|
0.64192 |
0.64431 |
0.63604 |
0.63614 |
0.64315 |
-0.00701 |
-1.09% |
|
DAILY PIVOT POINT |
||||||
|
R3 |
R2 |
R1 |
PIVOT |
S1 |
S2 |
S3 |
|
0.65140 |
0.64790 |
0.64320 |
0.63960 |
0.63490 |
0.63130 |
0.62660 |
USDCHF
.webp)
Suggest: Sell 0.92000 TP1 0.91800 TP2 0.91540 SL 0.92380
|
PREVIOUS RANGE |
||||||
|
OPEN |
HIGH |
LOW |
CLOSE |
PREV.CLOSE |
CHANGE |
%CHANGE |
|
0.91346 |
0.91926 |
0.91084 |
0.91804 |
0.91492 |
0.00312 |
0.34% |
|
DAILY PIVOT POINT |
||||||
|
R3 |
R2 |
R1 |
PIVOT |
S1 |
S2 |
S3 |
|
0.92840 |
0.92380 |
0.92000 |
0.91540 |
0.91150 |
0.90700 |
0.90310 |
USDJPY
.webp)
Suggest: Sell 149.960 TP1 149.670 TP2 149.480 SL 150.250
|
PREVIOUS RANGE |
||||||
|
OPEN |
HIGH |
LOW |
CLOSE |
PREV.CLOSE |
CHANGE |
%CHANGE |
|
149.602 |
149.859 |
149.376 |
149.844 |
149.387 |
0.457 |
0.31% |
|
DAILY PIVOT POINT |
||||||
|
R3 |
R2 |
R1 |
PIVOT |
S1 |
S2 |
S3 |
|
150.450 |
150.150 |
149.960 |
149.670 |
149.480 |
149.190 |
149.000 |
XUL (LOCO LONDON GOLD)
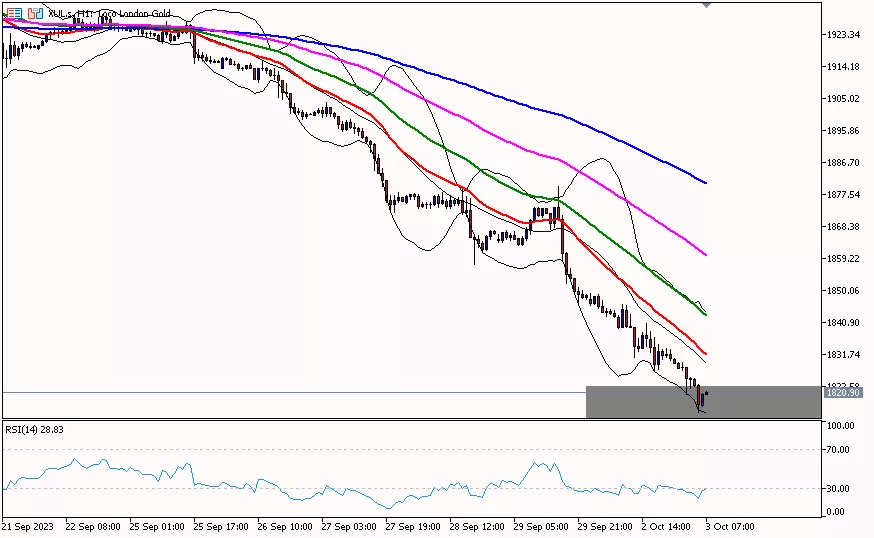
Suggest: Buy 1815.00 TP1 1820.00 TP2 1825.00 SL 1810.00
|
PREVIOUS RANGE |
||||||
|
OPEN |
HIGH |
LOW |
CLOSE |
PREV.CLOSE |
CHANGE |
%CHANGE |
|
1847.58 |
1849.08 |
1827.02 |
1827.79 |
1848.64 |
-20.85 |
-1.13% |
|
DAILY PIVOT POINT |
||||||
|
R3 |
R2 |
R1 |
PIVOT |
S1 |
S2 |
S3 |
|
1870.80 |
1860.00 |
1848.80 |
1837.90 |
1826.70 |
1815.80 |
1804.70 |
CLSK (OIL)
.webp)
Suggest: Buy 87.50 TP1 88.00 TP2 88.50 SL 87.00
|
PREVIOUS RANGE |
||||||
|
OPEN |
HIGH |
LOW |
CLOSE |
PREV.CLOSE |
CHANGE |
%CHANGE |
|
90.80 |
91.85 |
88.44 |
88.74 |
90.89 |
-2.15 |
-2.37% |
|
DAILY PIVOT POINT |
||||||
|
R3 |
R2 |
R1 |
PIVOT |
S1 |
S2 |
S3 |
|
94.33 |
93.09 |
90.92 |
89.68 |
87.51 |
86.27 |
84.10 |