Here is the daily technical analysis for September 18, 2023. The data and analysis in this bulletin can be broadly used for your trading. However, please note that GICTrade and data providers are not responsible for your trading outcomes. Therefore, the responsibility lies with you.
 
Before delving into today's technical analysis, be sure to register for GIC Big Deals, which offers exclusive benefits and various exciting prizes. This event runs for a limited time, from July 10 to December 31, 2023.
 
Next, we will provide forecasts for price movements in Forex and commodities, complete with calculations for pivot points, resistance, and support levels.


EURUSD

The EUR/USD pair in the 1-hour period attempted to move downward, reaching a support level at 1.06540 before heading towards the next support level at 1.06220. A downward trend is also indicated by the FXBot template, where the EUR score is lower at 4.0 compared to the USD score of 4.1. Additionally, the bearish bias is supported by a sell signal indicated by a red arrow.

Suggest: Sell 1.06540 TP1 1.06220 TP2 1.05990 SL 1.06770

PREVIOUS RANGE

OPEN

HIGH

LOW

CLOSE

PREV.CLOSE

CHANGE

%CHANGE

1.06422

1.06858

1.06312

1.06583

1.06422

0.00161

0.15%

DAILY PIVOT POINT

R3

R2

R1

PIVOT

S1

S2

S3

1.07310

1.07090

1.06770

1.06540

1.06220

1.05990

1.05680


GBPUSD

In the 1-hour period, GBP/USD attempted to move down, reaching a support level at 1.23790 and heading towards the next support level at 1.23480. However, the downward trend is not yet apparent from the FXBot template, where the GBP score is higher at 4.8 compared to the USD score of 3.8. The bearish bias is also supported by a sell signal indicated by a red arrow.

Suggest: Buy 1.23790 TP1 1.23480 TP2 1.23200 SL 1.24090

PREVIOUS RANGE

OPEN

HIGH

LOW

CLOSE

PREV.CLOSE

CHANGE

%CHANGE

1.24073

1.24073

1.23770

1.23806

1.24080

-0.00274

-0.22%

DAILY PIVOT POINT

R3

R2

R1

PIVOT

S1

S2

S3

1.24390

1.24230

1.24090

1.23930

1.23790

1.23630

1.23480


AUDUSD


In the 1-hour period, AUD/USD attempted to move up, reaching a resistance level at 0.64400 and heading towards the next resistance level at 0.64890. The upward trend is also supported by the FXBot template, where the AUD score is higher at 5.4 compared to the USD score of 3.8. The bullish bias is further supported by a buy signal indicated by a green arrow.

Suggest: Buy 0.64400 TP1 0.64570 TP2 0.64890 SL 0.64200

PREVIOUS RANGE

OPEN

HIGH

LOW

CLOSE

PREV.CLOSE

CHANGE

%CHANGE

0.64383

0.64715

0.64228

0.64285

0.64383

-0.00098

-0.16%

DAILY PIVOT POINT

R3

R2

R1

PIVOT

S1

S2

S3

0.65060

0.64890

0.64570

0.64400

0.64090

0.63910

0.63600


USDCHF


In the 1-hour period, USD/CHF attempted to move up, reaching a resistance level at 0.89780 and heading towards the next resistance level at 0.90100. The upward trend is also visible from the FXBot template, where the CHF score is lower at 1.0 compared to the USD score of 3.8. The bullish bias is further supported by a buy signal indicated by a green arrow.

Suggest: Buy 0.89780 TP1 0.89930 TP2 0.90100 SL 0.89600

PREVIOUS RANGE

OPEN

HIGH

LOW

CLOSE

PREV.CLOSE

CHANGE

%CHANGE

0.89541

0.89753

0.89436

0.89719

0.89541

0.00178

0.20%

DAILY PIVOT POINT

R3

R2

R1

PIVOT

S1

S2

S3

0.90100

0.89930

0.89780

0.89610

0.89470

0.89290

0.89150


USDJPY

In the 1-hour period, USD/JPY attempted to move down, reaching a support level at 147.630 and heading towards the next support level at 147.330. The downward trend is also supported by the FXBot template, where the JPY score is higher at 4.6 compared to the USD score of 3.8. The bearish bias is also supported by a sell signal indicated by a red arrow.
Suggest: Sell 147.630 TP1 147.330 TP2 147.020 SL 147.900

PREVIOUS RANGE

OPEN

HIGH

LOW

CLOSE

PREV.CLOSE

CHANGE

%CHANGE

147.448

147.933

147.320

147.828

147.448

0.380

0.26%

DAILY PIVOT POINT

R3

R2

R1

PIVOT

S1

S2

S3

148.550

148.240

147.940

147.630

147.330

147.020

146.710


XUL (LOCO LONDON GOLD)
 
In the 1-hour period, the gold price attempted to move up, reaching a resistance level at 1938.90 and heading towards the next resistance level at 1947.50. The bullish bias is also supported by a buy signal indicated by a green arrow.

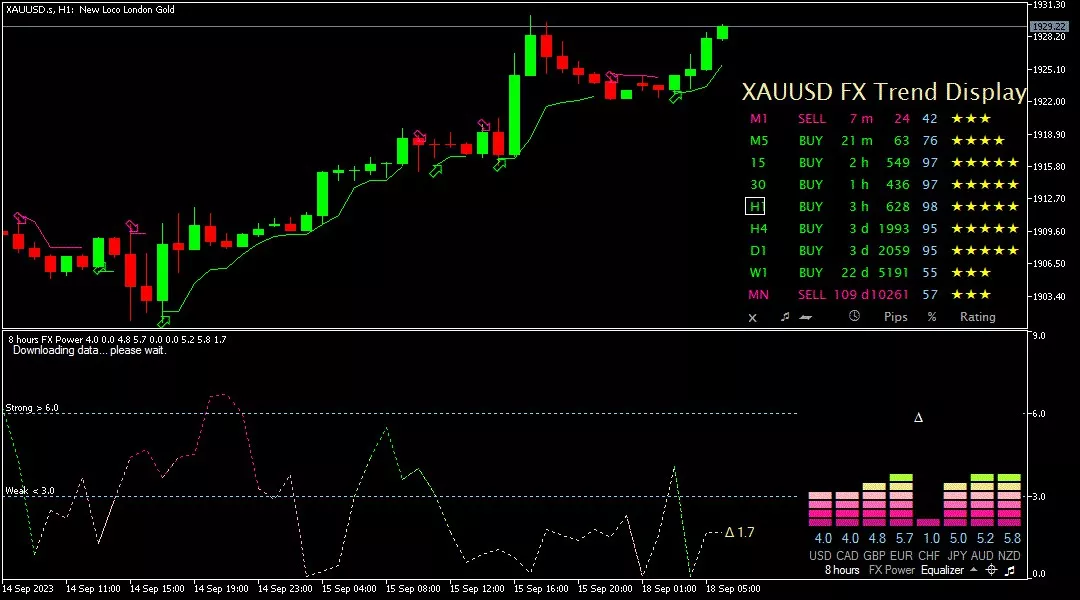
Suggest: Sell 1929.00 TP1 1926.00 TP2 1918.30 SL 1933.00

PREVIOUS RANGE

OPEN

HIGH

LOW

CLOSE

PREV.CLOSE

CHANGE

%CHANGE

1910.19

1930.26

1909.67

1923.09

1909.82

13.27

0.69%

DAILY PIVOT POINT

R3

R2

R1

PIVOT

S1

S2

S3

1947.50

1938.90

1926.90

1918.30

1906.30

1897.70

1885.80


CLSK (OIL)


In the 1-hour period, the oil price attempted to move up, needing to surpass a resistance level at 91.78 before heading towards the next resistance level at 92.43. To shift the bias to bearish, the oil price needs to drop below a support level at 90.90 and then to the next support level at 90.50.

Suggest: Sell 92.00 TP1 91.50 TP2 91.00 SL 92.50

PREVIOUS RANGE

OPEN

HIGH

LOW

CLOSE

PREV.CLOSE

CHANGE

%CHANGE

90.65

91.14

89.20

91.12

90.58

0.54

0.60%

DAILY PIVOT POINT

R3

R2

R1

PIVOT

S1

S2

S3

93.72

92.43

91.78

90.49

89.84

88.55

87.90

Here is the explanation of the "Daily Technical Analysis: September 18, 2023 – US Dollar Enters Consolidation Phase." Also, read our other articles, such as guides on how to buy cryptocurrency, available only in the GIC Journal. Don't forget to hone your trading skills by getting the Scalping Guide eBook and participating in Live Trading at NFP Live Trading. Make sure to download the GIC Mobile App from the Google Play Store.