 Last:
Last: 
Stock trading is an activity that is of interest to many people. However, stock trading can also be very risky if not done carefully.
Therefore, technical analysis can help traders make wiser decisions when investing in the stock market. One of the most commonly used technical analysis tools is the stock chart.
.webp)
Stock charts provide a visual representation of a stock’s price movements, and can help traders identify patterns that indicate a possible change in price trend.
In this post, we’ll discuss the double top pattern in stock trading and how to identify it on a stock chart.
Table of Contents
Definition of Double Top Pattern
A double top pattern is a trend reversal pattern that appears on a stock chart. This pattern is formed when the stock price rises to a new high, falls to a support level, rises again to a new high, and then falls again to the same support level as before.
This pattern indicates that the stock price has reached a significant resistance level twice, but failed to break through it, and then experienced a significant decline.
A double top pattern usually indicates a possible trend change from bullish to bearish. The characteristics of a double top pattern include peaks that are relatively the same height, a support line formed by the same price level, and a price decline after reaching the second peak.
In identifying a double top pattern, traders must pay close attention to these characteristics to ensure that the pattern is actually formed on the stock chart.
Example of a Stock Chart Showing a Double Top Pattern
The following is an example of a stock chart showing a double top pattern:
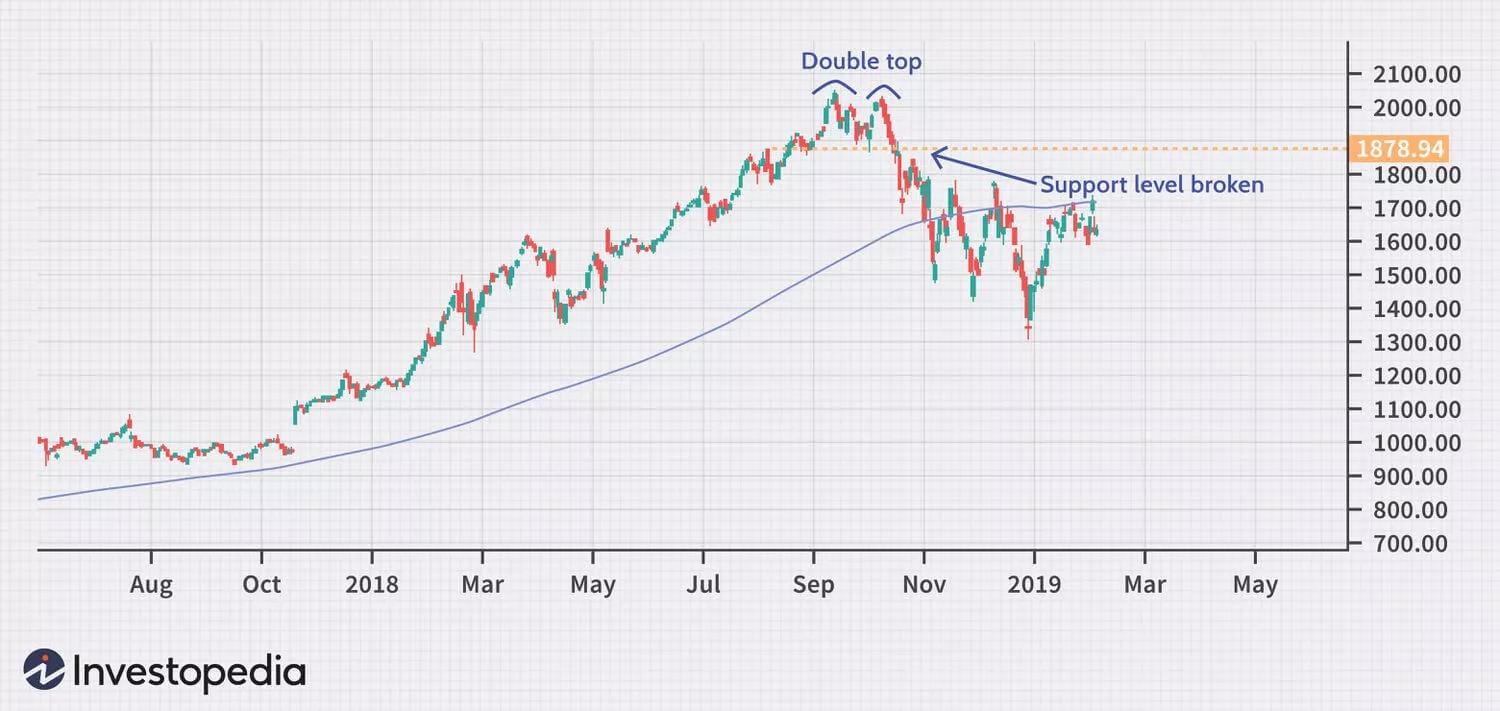
As can be seen from the chart above, the stock price made new highs on two separate occasions, but failed to break through significant resistance levels on both occasions.
After reaching the second high, the stock price experienced a significant decline and tested the same support level as before. This indicates strong selling pressure and a possible trend change from bullish to bearish.
A trader who identifies a double top pattern on a stock chart like this may consider selling his position or placing a put option to take advantage of the expected price decline.
However, it is important to remember that not all double top patterns end in significant price declines, so traders should conduct further analysis before making investment decisions.
Maximize Forex Trading Profits, Download the Application Now!
How to Identify Double Top Patterns on Forex and Stock Charts
Identifying a double top pattern on a stock chart can help traders make better investment decisions. Here are the steps to identify a double top pattern on a stock chart:
- Examine the stock chart to find two price peaks that are nearly identical. Both peaks should have the same resistance level or around the same level.
- Pay attention to the trading volume at the first peak and the second peak. The trading volume at the first peak should be higher than the trading volume at the second peak.
- If the stock price falls below a significant support level between two peaks, this may signal a possible trend change from bullish to bearish.
- Confirmation of a double top pattern can occur when the stock price falls below a significant support level between two peaks and trading volume increases during the decline.
In addition, it is important to understand resistance levels and how to determine them. Resistance levels are certain stock price levels where sellers take control and the stock price has difficulty rising above them.
There are two types of resistance levels, namely resistance levels that are tested several times and resistance levels that are broken. Traders should pay attention to these levels when identifying double top patterns on stock charts.
By following these steps and understanding resistance levels, traders can better identify double top patterns and make more informed investment decisions.
However, it is important to remember that technical analysis is only one aspect of investing and cannot be relied on entirely in making investment decisions.
Trading Strategy with Double Top Pattern
The double top pattern can provide important signals to traders about changes in stock price trends. Here are some trading strategies that can be used with the double top pattern:
- Short Selling: If the stock price falls below a significant support level between two peaks and trading volume increases during the decline, this can signal a possible trend change from bullish to bearish. In this situation, traders can short sell, which is selling shares that are not yet owned in the hope of buying them back later at a lower price.
- Stop Loss: It is important to place a stop loss when trading with the double top pattern. A stop loss can help reduce the risk of loss in a trade if the stock price rises above the same resistance level or around the same level.
- Fundamental Analysis: Traders should also consider fundamental factors that can affect stock prices in addition to technical analysis. Factors such as the company's financial performance, the global economic situation, and industry developments can also affect stock prices.
- Double Top Pattern Confirmation: Before trading with the double top pattern, traders must ensure that this pattern has been confirmed. The double top pattern only provides signals, but does not always guarantee a definite trend change.
When trading with a double top pattern, it is important to follow a strategy that suits each trader's trading style and risk level. This can help increase the chances of success and reduce the risk of loss.
also read:
|
Double Bottom Pattern: Characteristics, Terms, How to Read, and Examples |
FAQ
Here are some frequently asked questions related to the double top pattern:
Does the double top pattern always indicate a bearish trend change?
Not always. The double top pattern only provides a signal, but does not guarantee a definite trend change. However, this pattern can be an early sign of a trend change from bullish to bearish.
How long does it take for a double top pattern to form?
There is no definite time. A double top pattern forms when the stock price reaches the same resistance level or around the same level twice. The time it takes for this pattern to form depends on the movement of the stock price.
What should you do if you have identified a double top pattern on a stock chart?
After identifying a double top pattern, traders can consider a trading strategy that suits their trading style and risk level, such as short selling or placing a stop loss.
Do fundamental factors also affect the stock price in a double top pattern?
Yes, fundamental factors such as the company's financial performance, the global economic situation, and industry developments can also affect stock prices apart from technical analysis.
How to avoid mistakes in trading with a double top pattern?
Traders can avoid mistakes in trading with double top patterns by conducting a more thorough analysis, using other technical indicators as confirmation, and following a previously prepared trading plan.
Conclusion
The double top pattern is one of the chart patterns that can help traders identify potential trend changes on stock charts.
This pattern is formed when the stock price reaches the same resistance level or around the same level twice. The double top pattern provides an early signal that the bullish trend will change to bearish.
In trading with the double top pattern, traders can consider trading strategies that suit their trading style and risk level, such as short selling or placing a stop loss.
However, traders also need to consider other fundamental factors that can affect stock prices apart from technical analysis.
To avoid mistakes in trading with the double top pattern, traders need to conduct a more thorough analysis, use other technical indicators as confirmation, and follow a previously prepared trading plan.
By understanding the double top pattern and how to identify it, traders can improve their technical analysis skills and make wiser trading decisions.
References:
Murphy, J.J. (1999). Technical Analysis for Maximum Profit. Jakarta: PT. Gramedia Pustaka Utama.
StockCharts.com. (2021). ChartSchool - Chart Analysis - Chart Patterns - Double Top. Retrieved on March 27, 2023 from https://stockcharts.com/school/doku.php?id=chart_school:chart_analysis:chart_patterns:double_top.
TradingView.com. (2023). Double Top. Retrieved on March 28, 2023 from https://www.tradingview.com/chart-patterns/double-top/.


