Last:
Last: 
Candlestick Patterns That Can Help You Predict Trends - Stock trading is a very exciting activity, especially if you have the ability to correctly predict the next trend. However, this is not something that is easy to do, because financial markets are always moving and difficult to predict.
.webp)
Table of Contents
5 Candlestick Patterns That Can Help You Predict Your Next Trend
Here are 5 important candlestick patterns that can help you predict the next trend in stock trading:
1. Bullish Engulfing Pattern
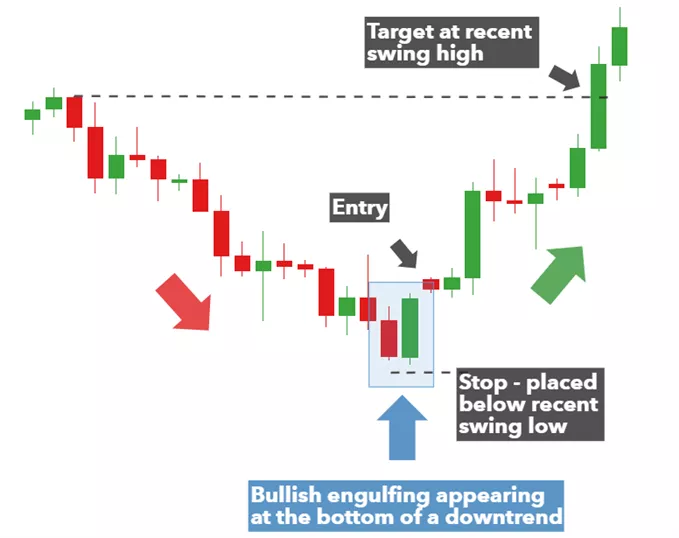
Bullish Engulfing Pattern occurs when a large bullish candlestick completely covers a smaller bearish candlestick in the previous period. This pattern indicates that buyers have taken control of the sellers, and this can be a signal to buy the stock.
How to Recognize a Bullish Engulfing Pattern:
- Make sure that the first candlestick is bearish.
- The second bullish candlestick should be larger than the first bearish candlestick.
- Make sure that the second candlestick completely covers the first candlestick.
2. Bearish Engulfing Pattern
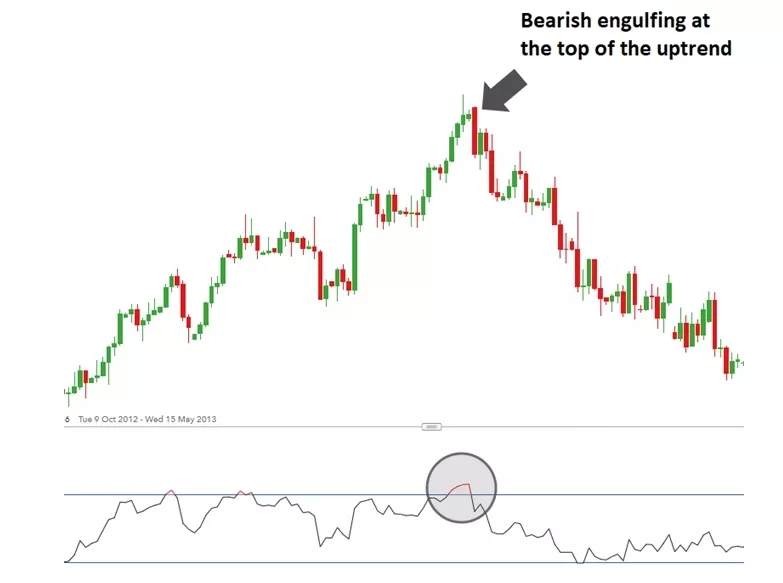
Bearish Engulfing Pattern It occurs when a large bearish candlestick completely covers a smaller bullish candlestick in the previous period. This pattern indicates that sellers have taken control away from buyers, and this can be a signal to sell the stock.
How to Recognize a Bearish Engulfing Pattern:
- Make sure that the first candlestick is bullish.
- The second bearish candlestick should be larger than the first bullish candlestick.
- Make sure that the second candlestick completely covers the first candlestick.
3. Bullish Harami Pattern
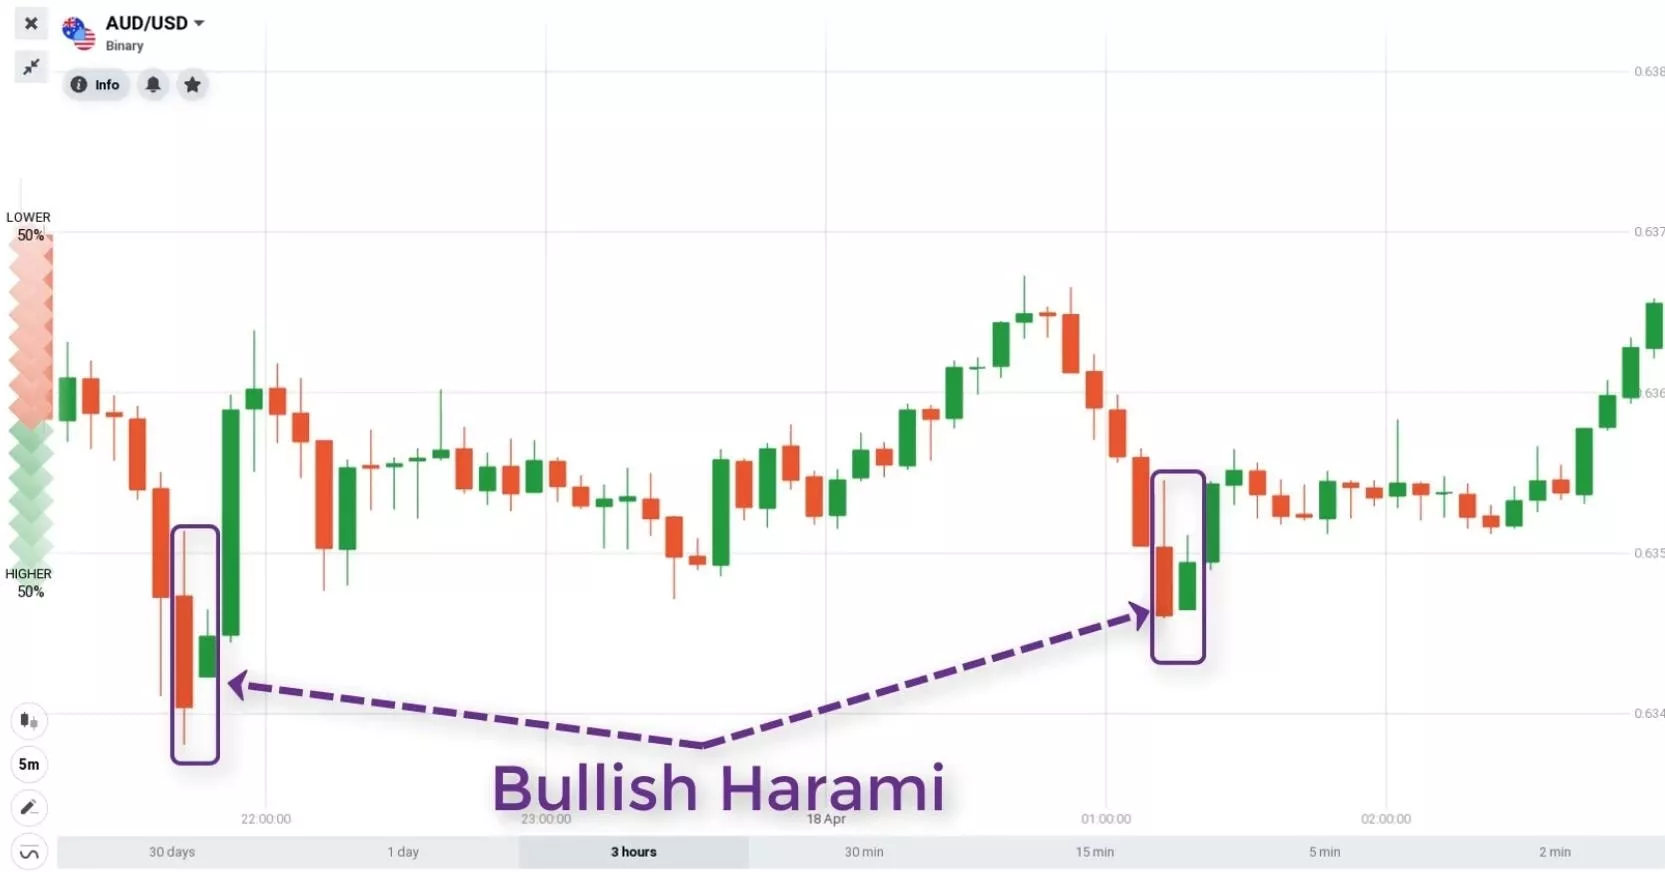
Bullish Harami Pattern It occurs when a small bearish candlestick is followed by a small bullish candlestick. This pattern indicates that the market is weakening, and buyers are starting to enter the market.
How to Recognize the Harami Bullish Pattern:
- Make sure that the first candlestick is bearish.
- Make sure that the second bullish candlestick is smaller than the first bearish candlestick.
- Make sure that the second candlestick is completely inside the first candlestick.
4. Bearish Harami Pattern
The Harami Bearish pattern occurs when a small bullish candlestick is followed by a small bearish candlestick. This pattern indicates that the market is strong, and sellers are starting to enter the market.
How to recognize the Harami bearish pattern:
- Make sure that the first candlestick is bullish.
- Make sure that the second bearish candlestick is smaller than the first bullish candlestick.
- Make sure that the second candlestick is completely inside the first candlestick.
5. Doji Pattern
Doji Pattern occurs when the opening and closing prices are the same or almost the same, so the candlestick looks like the letter "T" or a cross. This pattern indicates that the market is indecisive, and the price may move up or down.
How to Recognize Doji Patterns:
- Make sure that the candlestick has a very small body.
- Make sure that the opening and closing prices are almost the same or the same.
- Make sure that the top and bottom shadows are long and balanced.
Also Read : Complete Candlestick Patterns: Bullish, Bearish, and Continuation Patterns
Get to know GIC, the trusted trading platform and market maker in Indonesia!
Not familiar with GIC? Let's get acquainted. Unlike other conventional brokerage firms, GIC through the GICTrade platform provides a solution for traders who do not want to be charged with high trading fees. GICTrade is a peer-to-peer trading platform that brings together traders and market makers.
So, what is special about GICTrade? As a platform that brings together traders and market makers, you as a potential customer can certainly choose between the two, namely becoming a trader or a market maker. GICTrade's role as a transaction venue provider can minimize costs and help maximize profits for traders and market makers as well as create a fair transaction atmosphere and results.
FAQs
Are candlestick patterns always accurate in predicting market trends?
Candlestick patterns are not always accurate in predicting market trends, as financial markets are complex and difficult to predict. Candlestick patterns only provide an indication of the direction of the market, so they are not always reliable as the only factor in trading decision-making. However, candlestick patterns can provide useful signals in predicting stock price movements and help traders to make better decisions.
Are there any other candlestick patterns to look out for?
Yes, there are many other candlestick patterns to look out for, such as the Hammer, Shooting Star, Morning Star, and Evening Star patterns. Each candlestick pattern has different meanings and implications, so traders must understand each pattern well to be able to utilize it effectively in trading.
Do I need to be an expert in understanding candlestick patterns?
You don't need to be an expert in understanding candlestick patterns to be able to use them in trading. However, the more you understand these patterns, the better you can predict market trends and make better trading decisions. You can learn candlestick patterns through books, articles, video tutorials, or online trading courses.
How can I apply candlestick patterns in trading?
You can apply candlestick patterns in trading by identifying patterns that appear on stock price charts and using them as signals to buy or sell stocks. However, you should also always pay attention to other factors that affect the market and manage risk appropriately. In addition, you can also use other technical analysis tools, such as technical indicators, to strengthen your trading decisions.
What should I do if I am wrong in predicting a candlestick pattern?
If you are wrong in predicting candlestick patterns, you should always manage your risk appropriately to avoid large losses. You can place a stop loss order to limit your losses if the stock price moves against your prediction. In addition, you can also learn from your mistakes and continue to improve your trading skills.
Conclusion
In stock trading, candlestick patterns can be a useful tool in predicting market trends and making better trading decisions. In this article, we have discussed 5 important candlestick patterns that can help you predict the next trend in stock trading, namely the Bullish Engulfing, Bearish Engulfing, Bullish Harami, Bearish Harami, and Doji patterns. However, it is important to remember that candlestick patterns are not always accurate in predicting market trends and cannot be used as the sole factor in trading decision-making. You should always pay attention to other factors that affect the market, such as economic news, government policies, and industry conditions, and manage risks appropriately.
In addition, you should also keep improving your trading skills by studying other candlestick patterns and other technical analysis tools, such as technical indicators. You can take advantage of learning resources such as books, articles, video tutorials, or online trading courses to improve your trading skills. In conclusion, candlestick patterns are an important tool in stock trading, but they are not the only factor to consider in making trading decisions. By understanding candlestick patterns and other factors that affect the market, as well as managing risk appropriately, you can improve your trading skills and profit from stock trading.
Reference:
- "Japanese Candlestick Charting Techniques" oleh Steve Nison
- "Technical Analysis of the Financial Markets" oleh John J. Murphy
- "The Complete Guide to Japanese Candlestick Charting" oleh Dan Gramza
- "Candlestick Charting Explained" oleh Gregory Morris