Last:
Last: 
The following is a technical daily analysis, May 3, 2023. The data and analysis contained in this newsletter can be used on a wide scale for your trading. However, it is important to note that GICTrade and its data providers are not responsible for your trading results.
So, it's your own responsibility. Before knowing today's technical analysis, immediately register yourself to take part in the GIC Gebyar Prize and get the main prize, namely Mobile Mitshubshi Expander or Vacation Package to Labuan Bajo for 4 days and 3 nights.
In the following, we will inform you about the forecast of price movements in Forex and Commodities which is equipped with the calculation of Pivot points, Resistance and Support levels.
EURUSD
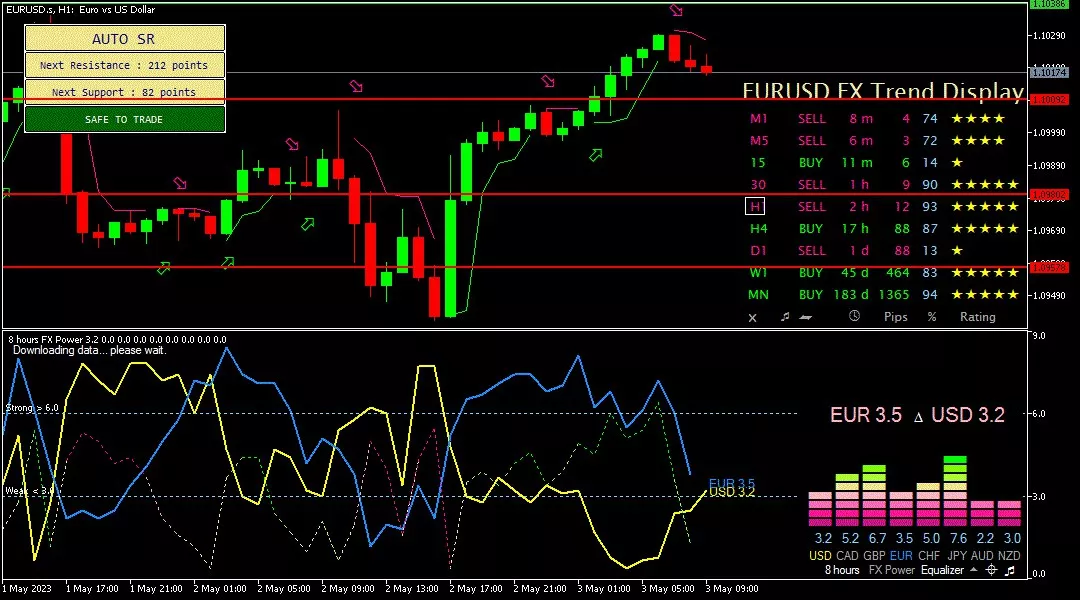
EUR/USD on the 1-hour period tried to move down, touching the support level at 1.09810 until heading to the next support level at 1.09550. However, the downward trend is still quite weak as seen from the FXBot template, where the EUR figure is slightly higher by 3.5 than the USD figure of 3.2. While the bearish trend is also supported by sell signals indicated by red arrows.
Suggest: Sell 1.09810 TP1 1.09550 TP2 1.09150 SL 1.10210
|
PREVIOUS RANGE |
||||||
|
OPEN |
HIGH |
LOW |
CLOSE |
PREV.CLOSE |
CHANGE |
%CHANGE |
|
1.09756 |
1.10073 |
1.09414 |
1.09985 |
1.09756 |
0.00229 |
0.21% |
|
DAILY PIVOT POINT |
||||||
|
R3 |
R2 |
R1 |
PIVOT |
S1 |
S2 |
S3 |
|
1.10870 |
1.10470 |
1.10210 |
1.09810 |
1.09550 |
1.09150 |
1.08890 |
GBPUSD
GBP/USD on the 1-hour period tried to move upwards touching the resistance level at 1.25190 until heading to the next resistance level at 1.25540. The upward trend can also be seen from the FXBot template, where the GBP figure is higher by 5.5 than the USD figure of 2.7. While the bullish bias is also supported by a buy signal indicated by a green arrow.
Suggest: Buy 1.25190 TP1 1.25540 TP2 1.25960 SL 1.24800
|
PREVIOUS RANGE |
||||||
|
OPEN |
HIGH |
LOW |
CLOSE |
PREV.CLOSE |
CHANGE |
%CHANGE |
|
1.24943 |
1.25115 |
1.24349 |
1.24666 |
1.24946 |
-0.00280 |
-0.22% |
|
DAILY PIVOT POINT |
||||||
|
R3 |
R2 |
R1 |
PIVOT |
S1 |
S2 |
S3 |
|
1.25960 |
1.25540 |
1.25190 |
1.24770 |
1.24430 |
1.24000 |
1.23660 |
AUDUSD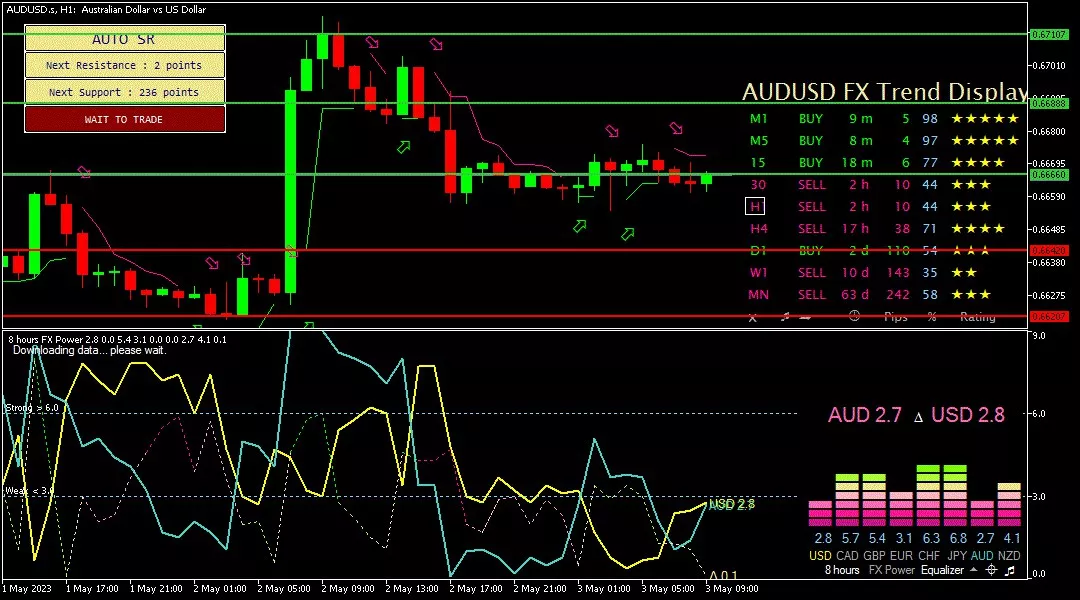
AUD/USD in the 1-hour period tried to move down, touching the support level at 0.66570 until heading to the next support level at 0.65980. The downward trend can also be seen from the FXBot template, where the AUD figure is lower by 2.7 than the USD figure of 2.8. While the bearish bias is also supported by a sell signal indicated by a red arrow.
Suggest: Sell 0.66570 TP1 0.65980 TP2 0.66600 SL 0.66940
|
PREVIOUS RANGE |
||||||
|
OPEN |
HIGH |
LOW |
CLOSE |
PREV.CLOSE |
CHANGE |
%CHANGE |
|
0.66287 |
0.67164 |
0.66198 |
0.66620 |
0.66296 |
0.00324 |
0.48% |
|
DAILY PIVOT POINT |
||||||
|
R3 |
R2 |
R1 |
PIVOT |
S1 |
S2 |
S3 |
|
0.67910 |
0.67540 |
0.66940 |
0.66570 |
0.65980 |
0.65600 |
0.65010 |
USDCHF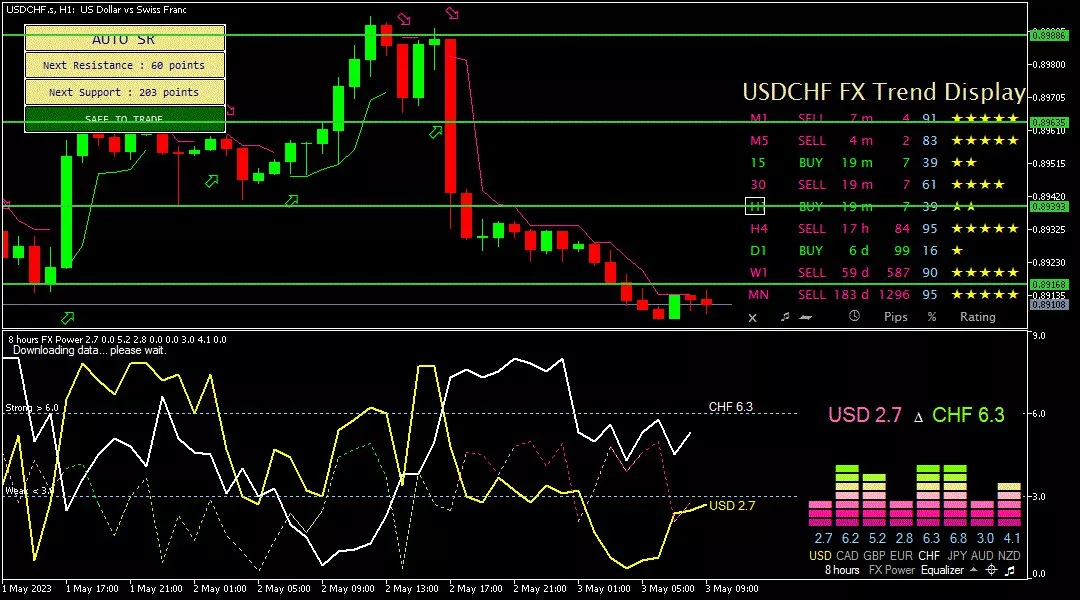
USD/CHF on the 1-hour period is trying to move further down, needing to break through the support level at 0.88800 to the next support level at 0.88370. The downward trend can also be seen from the FXBot template, where the CHF figure is higher by 6.3 from the USD figure of 2.7. While the bearish bias is also supported by a sell signal indicated by a red arrow.
Suggest: Sell 0.88800 TP1 0.88370 TP2 0.88100 SL 0.89080
|
PREVIOUS RANGE |
||||||
|
OPEN |
HIGH |
LOW |
CLOSE |
PREV.CLOSE |
CHANGE |
%CHANGE |
|
0.89548 |
0.89941 |
0.89232 |
0.89320 |
0.89548 |
-0.00228 |
-0.26% |
|
DAILY PIVOT POINT |
||||||
|
R3 |
R2 |
R1 |
PIVOT |
S1 |
S2 |
S3 |
|
0.90500 |
0.90220 |
0.89790 |
0.89510 |
0.89080 |
0.88800 |
0.88370 |
USDJPY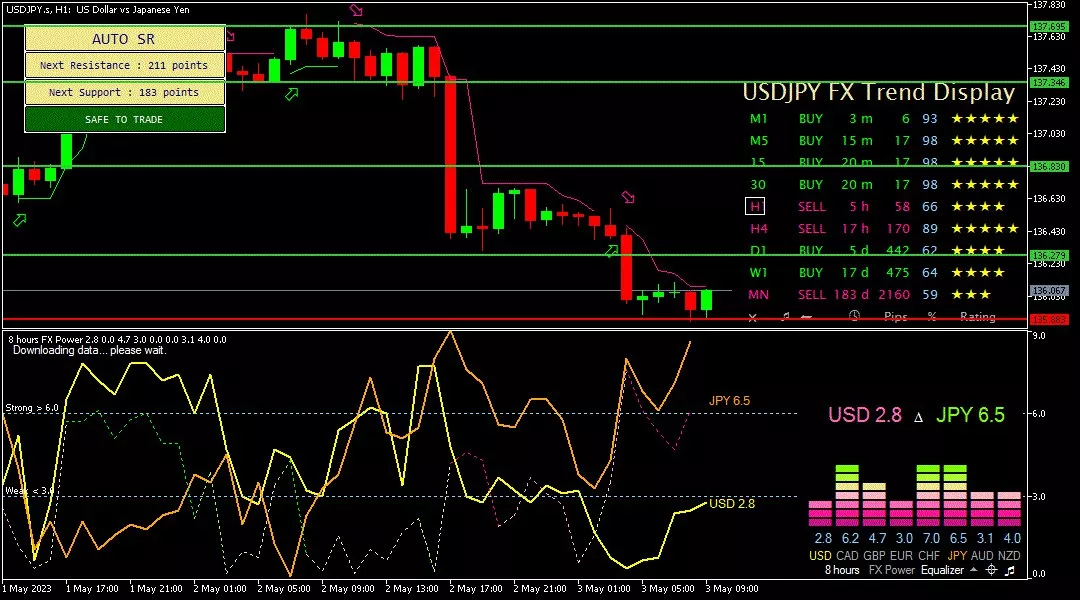
USD/JPY on the 1-hour period is trying to move down, needing to break through the support level at 135,800 to the next support level at 135,500. The downward trend can also be seen from the FXBot template, where the JPY figure is higher by 6.5 than the USD figure of 2.8. While the bearish trend is also supported by sell signals indicated by red arrows.
Suggest: Sell 135.800 TP1 135.500 TP2 135.000 SL 136.100
|
PREVIOUS RANGE |
||||||
|
OPEN |
HIGH |
LOW |
CLOSE |
PREV.CLOSE |
CHANGE |
%CHANGE |
|
137.467 |
137.765 |
136.310 |
136.551 |
137.456 |
-0.905 |
-0.66% |
|
DAILY PIVOT POINT |
||||||
|
R3 |
R2 |
R1 |
PIVOT |
S1 |
S2 |
S3 |
|
139.190 |
138.480 |
137.730 |
137.020 |
136.280 |
135.570 |
134.820 |
XUL (LOCO LONDON GOLD)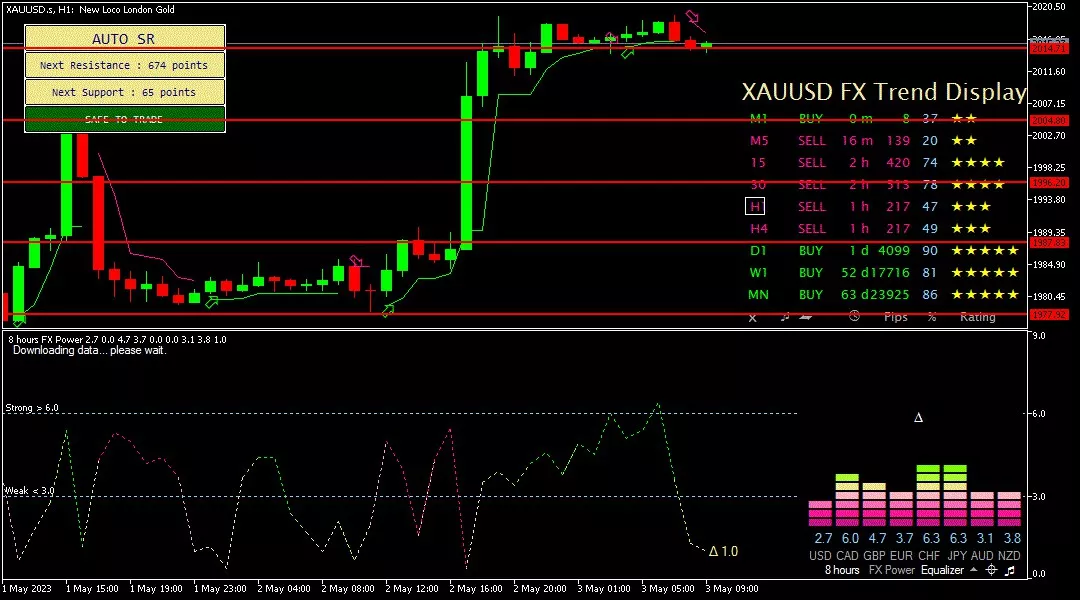
Gold prices in the 1-hour period tried to move down, touching the 2010.00 support area until the next support level at 2000.00. While the bearish trend is also supported by sell signals indicated by red arrows.
Suggest: Sell 2010.00 TP1 2005.00 TP2 2000.00 SL 2015.00
|
PREVIOUS RANGE |
||||||
|
OPEN |
HIGH |
LOW |
CLOSE |
PREV.CLOSE |
CHANGE |
%CHANGE |
|
1981.07 |
2019.22 |
1978.36 |
2016.05 |
1980.85 |
35.20 |
1.78% |
|
DAILY PIVOT POINT |
||||||
|
R3 |
R2 |
R1 |
PIVOT |
S1 |
S2 |
S3 |
|
2059.90 |
2039.60 |
2019.00 |
1998.70 |
1978.20 |
1957.80 |
1937.30 |
CLSK (OIL)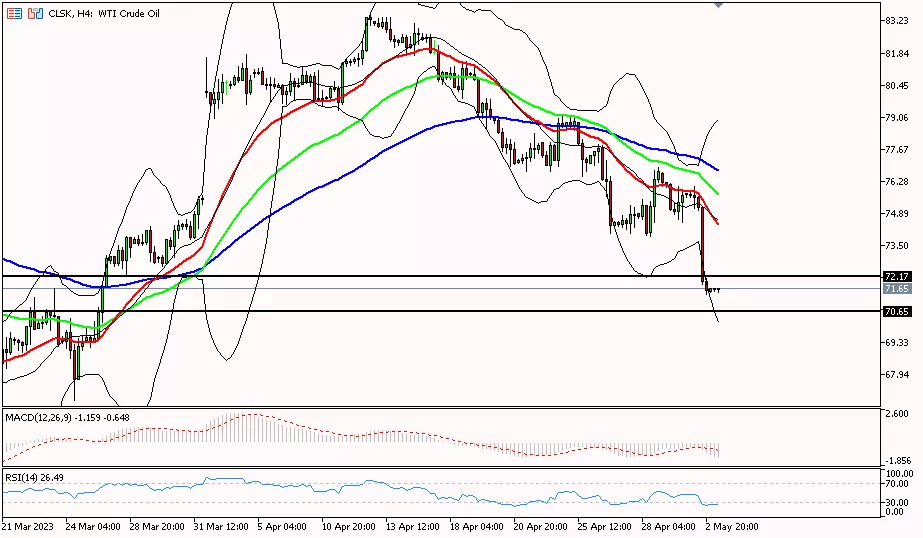
Oil prices in the 4-hour period tried to move further down, testing the support area at 70.65 until heading towards the next support level at 69.96. Meanwhile, to change the bias to bullish, oil prices need to pass the resistance level at 72.17 to the next resistance level at 73.02.
Suggest: Buy 72.17 TP1 73.02 TP2 74.00 SL 70.65
|
PREVIOUS RANGE |
||||||
|
OPEN |
HIGH |
LOW |
CLOSE |
PREV.CLOSE |
CHANGE |
%CHANGE |
|
75.74 |
76.08 |
71.41 |
71.57 |
75.66 |
-4.09 |
-5.41% |
|
DAILY PIVOT POINT |
||||||
|
R3 |
R2 |
R1 |
PIVOT |
S1 |
S2 |
S3 |
|
79.30 |
77.69 |
74.63 |
73.02 |
69.96 |
68.35 |
65.29 |
So, that's the explanation of "Technical Daily Analysis: May 3, 2023 – Listen! Ahead of the FOMC, Here's How the US Dollar Moves". Also read our other articles, such as an explanation of how to buy cryptocurrencies, only in the GIC Journal. Don't forget to practice your trading skills by getting the Scalping Ebook and following Live Trading on NFP Live Trading. Make sure, download GIC Mobile Apps on the Google Play Store.