Last:
Last: 
The following are technical daily analysis, 7 March 2023. The data and analysis contained in this newsletter can be used on a wide scale for your trading. However, it is important to note that GICTrade and its data providers are not responsible for your trading results.
So, it's your own responsibility. Before knowing today's technical analysis, immediately register yourself to take part in the GIC Gebyar Prize and get the main prize, namely Mobile Mitshubshi Expander or Vacation Package to Labuan Bajo for 4 days and 3 nights.
In the following, we will inform you about the forecast of price movements in Forex and Commodities which is equipped with the calculation of Pivot points, Resistance and Support levels.
EURUSD
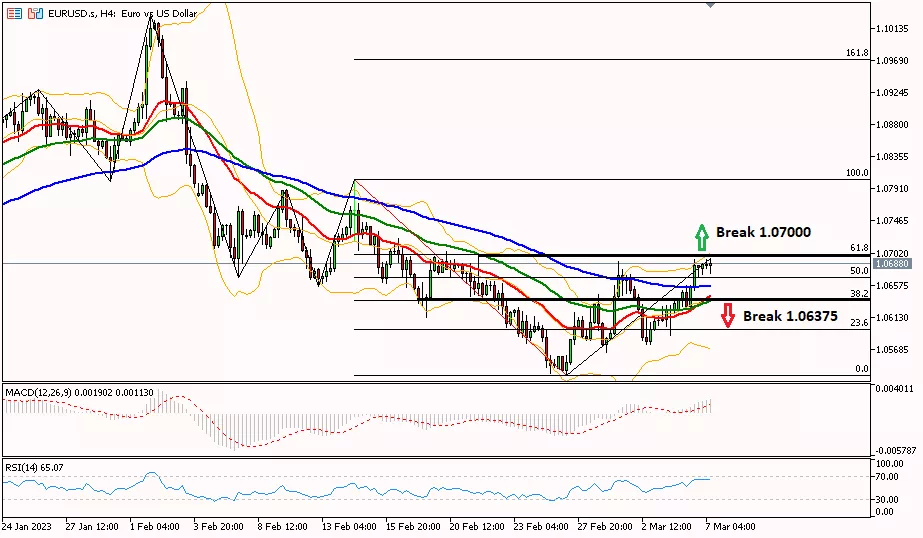
The EUR/USD pair on the 4-hour period moved upwards trying to touch the resistance area of 1.07000 which is also the 61.8 Fibonacci level, in order to continue the bullish bias towards the next resistance at 1.07610. The uptrend is also supported by the MA25 line which has crossed the MA50 line. However, the increase is limited because the RSI is already in the overbought area. Meanwhile, to turn the bias bearish, EUR/USD needs to break through the support area at 1.06375 towards the next support level at 1.05830.
Suggest : Sell 1.06375 TP1 1.05830 TP2 1.05440 SL 1.06550
|
PREVIOUS RANGE |
||||||
|
OPEN |
HIGH |
LOW |
CLOSE |
PREV.CLOSE |
CHANGE |
%CHANGE |
|
1.06232 |
1.06936 |
1.06213 |
1.06819 |
1.06314 |
0.00505 |
0.47% |
|
DAILY PIVOT POINT |
||||||
|
R3 |
R2 |
R1 |
PIVOT |
S1 |
S2 |
S3 |
|
1.07610 |
1.07270 |
1.06890 |
1.06550 |
1.06160 |
1.05830 |
1.05440 |
GBPUSD
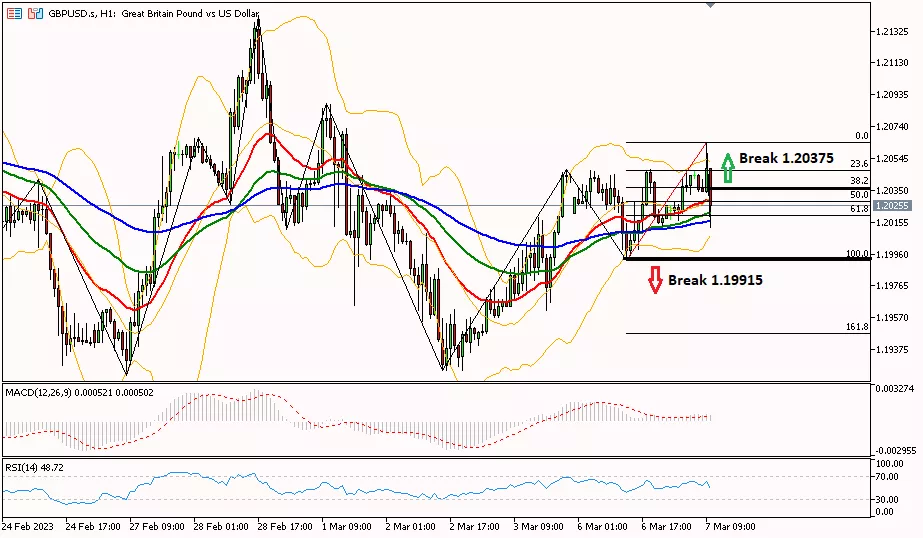
GBP/USD on the 1-hour period experienced a correction trying to touch the 1.19915 support area to continue the bearish bias towards the next support at 1.19660. As for further bullish bias, GBP/USD needs to break through the resistance area at 1.20375 towards the next resistance level at 1.20520.
Suggest : Sell 1.19915 TP1 1.19660 TP2 1.19400 SL 1.20220
|
PREVIOUS RANGE |
||||||
|
OPEN |
HIGH |
LOW |
CLOSE |
PREV.CLOSE |
CHANGE |
%CHANGE |
|
1.20207 |
1.20480 |
1.19921 |
1.20255 |
1.20435 |
-0.00180 |
-0.15% |
|
DAILY PIVOT POINT |
||||||
|
R3 |
R2 |
R1 |
PIVOT |
S1 |
S2 |
S3 |
|
1.21080 |
1.20780 |
1.20520 |
1.20220 |
1.19960 |
1.19660 |
1.19400 |
AUDUSD
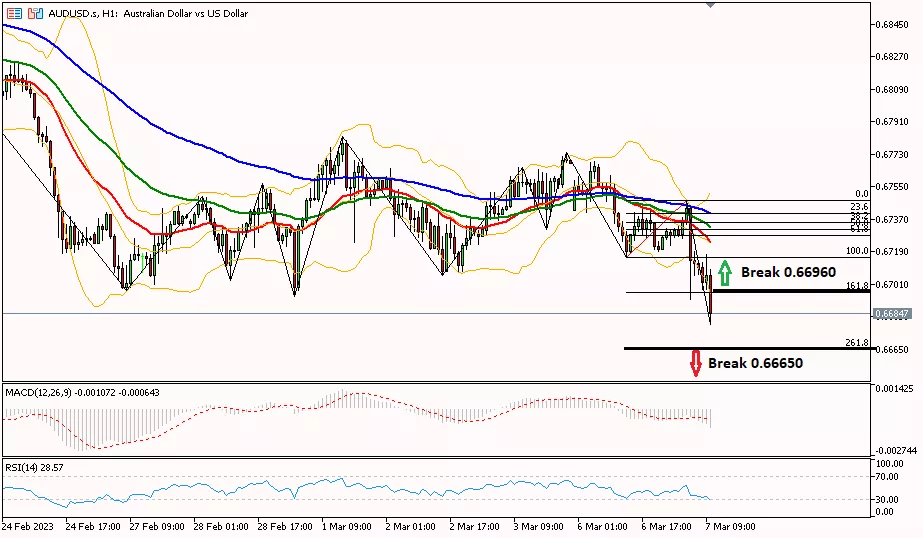
AUD/USD on the 1-hour period moved down, trying to touch the 0.66650 support area to turn the bias bearish until the next support at 0.66500. Meanwhile, to turn the bias into a bullish one, the AUDUSD needs to break through the resistance area at 0.66960 towards the next resistance level at 0.67390.
Suggest : Buy 0.66700 TP1 0.67090 TP2 0.67390 SL 0.66500
|
PREVIOUS RANGE |
||||||
|
OPEN |
HIGH |
LOW |
CLOSE |
PREV.CLOSE |
CHANGE |
%CHANGE |
|
0.67419 |
0.67687 |
0.67156 |
0.67299 |
0.67676 |
-0.00377 |
-0.56% |
|
DAILY PIVOT POINT |
||||||
|
R3 |
R2 |
R1 |
PIVOT |
S1 |
S2 |
S3 |
|
0.68160 |
0.67920 |
0.67620 |
0.67390 |
0.67090 |
0.66860 |
0.66560 |
USDCHF
.webp)
USD/CHF on the 1-hour period tried to rebound past the resistance level of 0.93410 to turn its bias bullish towards the next resistance level at 0.93680. The bullish bias is confirmed with the RSI already in the oversold area. As for further bearishness, USD/CHF needs to cross the support area at 0.92800 towards the next support level at 0.92690.
Suggest : Buy 0.93000 TP1 0.93410 TP2 0.93680 SL 0.92690
|
PREVIOUS RANGE |
||||||
|
OPEN |
HIGH |
LOW |
CLOSE |
PREV.CLOSE |
CHANGE |
%CHANGE |
|
0.93606 |
0.93719 |
0.93045 |
0.93060 |
0.93646 |
-0.00586 |
-0.63% |
|
DAILY PIVOT POINT |
||||||
|
R3 |
R2 |
R1 |
PIVOT |
S1 |
S2 |
S3 |
|
0.94350 |
0.94030 |
0.93680 |
0.93360 |
0.93000 |
0.92690 |
0.92330 |
USDJPY
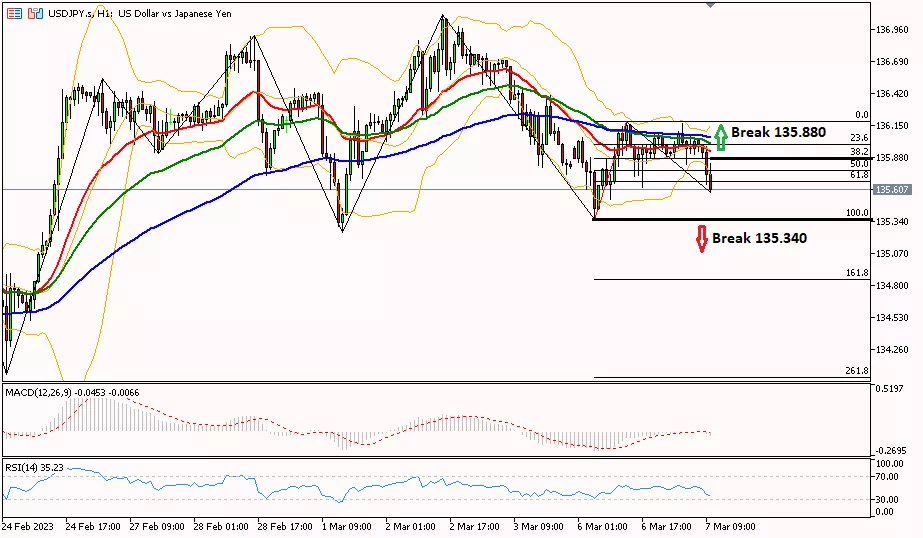
USD/JPY on the 1-hour period moved down, trying to touch the 135,340 support area for a further bearish bias towards the next support at 135,020. Meanwhile, to turn the bias into a bullish one, USD/JPY needs to break through the resistance area at 135,880 to the next resistance level at 136,340.
Suggest : Sell 135.340 TP1 135.020 TP2 134.690 SL 135.850
|
PREVIOUS RANGE |
||||||
|
OPEN |
HIGH |
LOW |
CLOSE |
PREV.CLOSE |
CHANGE |
%CHANGE |
|
135.959 |
136.186 |
135.360 |
135.912 |
135.809 |
0.103 |
0.07% |
|
DAILY PIVOT POINT |
||||||
|
R3 |
R2 |
R1 |
PIVOT |
S1 |
S2 |
S3 |
|
137.170 |
136.680 |
136.340 |
135.850 |
135.510 |
135.020 |
134.690 |
XUL (LOCO LONDON GOLD)
.webp)
Gold prices in the 1-hour period moved down, trying to touch the 1840.50 support area to change the bias to bearish until the next support at 1831.50. Meanwhile, to continue the bulls, gold needs to break through the resistance area at 1851.50 again to the next resistance level at 1857.80.
Suggest : Sell 1840.50 TP1 1835.00 TP2 1831.50 SL 1851.40
|
PREVIOUS RANGE |
||||||
|
OPEN |
HIGH |
LOW |
CLOSE |
PREV.CLOSE |
CHANGE |
%CHANGE |
|
1855.76 |
1858.12 |
1844.98 |
1846.77 |
1854.87 |
-8.10 |
-0.44% |
|
DAILY PIVOT POINT |
||||||
|
R3 |
R2 |
R1 |
PIVOT |
S1 |
S2 |
S3 |
|
1871.00 |
1864.50 |
1857.80 |
1851.40 |
1844.70 |
1838.30 |
1831.50 |
CLSK (OIL)
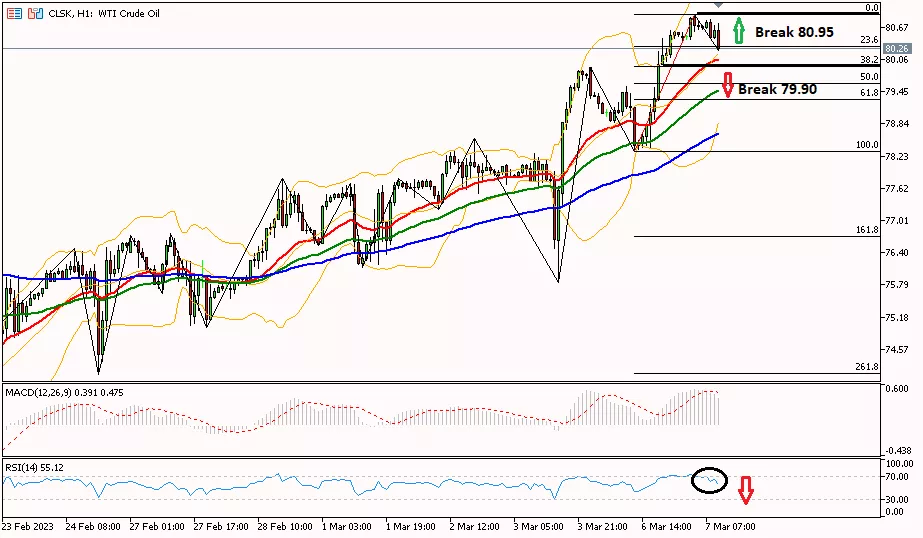
Oil prices in the 1-hour period moved a correction testing the 79.90 support area towards the next support level at 79.03. Meanwhile, for further bullish bias, oil prices need to cross the resistance level of 80.95 towards the next resistance at 81.33.
Suggest : Sell 79.90 TP1 79.03 TP2 78.50 SL 80.50
|
PREVIOUS RANGE |
||||||
|
OPEN |
HIGH |
LOW |
CLOSE |
PREV.CLOSE |
CHANGE |
%CHANGE |
|
79.90 |
80.61 |
78.31 |
80.53 |
79.78 |
0.75 |
0.94% |
|
DAILY PIVOT POINT |
||||||
|
R3 |
R2 |
R1 |
PIVOT |
S1 |
S2 |
S3 |
|
83.63 |
82.12 |
81.33 |
79.82 |
79.03 |
77.52 |
76.73 |
So, that's the explanation of "Technical Daily Analysis: March 7, 2023 – US Dollar Rebound". Also read our other articles, such as an explanation of how to buy cryptocurrencies, only in the GIC Journal. Don't forget to practice your trading skills by getting the Scalping Ebook and following Live Trading on NFP Live Trading. Make sure, download GIC Mobile Apps on the Google Play Store.
Warning!
This analysis is based on fundamental and technical views from reliable sources, and is not a suggestion or invitation. Always remember that this content aims to enrich the reader's information. Always use independent research first on other forex information to use as a reference in your trading.