Last:
Last: 
The following is a daily technical analysis, February 28, 2023. The data and analysis contained in this newsletter can be used on a wide scale for your trading. However, it is important to note that GICTrade and its data providers are not responsible for your trading results.
So, it's your own responsibility. Before knowing today's technical analysis, immediately register yourself to take part in the GIC Gebyar Prize and get the main prize, namely Mobile Mitshubshi Expander or Vacation Package to Labuan Bajo for 4 days and 3 nights.
In the following, we will inform you about the forecast of price movements in Forex and Commodities which is equipped with the calculation of Pivot points, Resistance and Support levels.
EURUSD
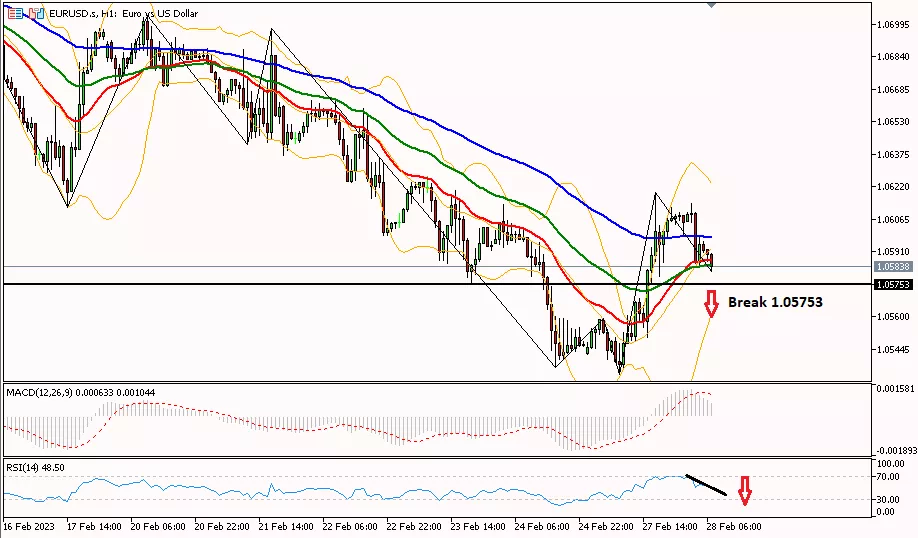
Daily Technical Analysis for EUR/USD on the 1-hour period is under pressure to test the support area at 1.05753. If it can be crossed, then the bearish bias will continue until the support level of 1.05330. Downward support can be seen from the RSI indicator which is already in the oversold area, this is also confirmed by the MACD hologram bars that are starting to shrink. Meanwhile, in order to turn the bias to be bullish, the EUR/USD pair must first pass the resistance level of 1.06200, heading to the next resistance at 1.06630.
Suggest : Sell 1.05750 TP1 1.05330 TP2 1.04890 SL 1.06200
|
PREVIOUS RANGE |
||||||
|
OPEN |
HIGH |
LOW |
CLOSE |
PREV.CLOSE |
CHANGE |
%CHANGE |
|
1.05424 |
1.06191 |
1.05324 |
1.06081 |
1.05469 |
0.00612 |
0.58% |
|
DAILY PIVOT POINT |
||||||
|
R3 |
R2 |
R1 |
PIVOT |
S1 |
S2 |
S3 |
|
1.07060 |
1.06630 |
1.06200 |
1.05760 |
1.05330 |
1.04890 |
1.04460 |
GBPUSD
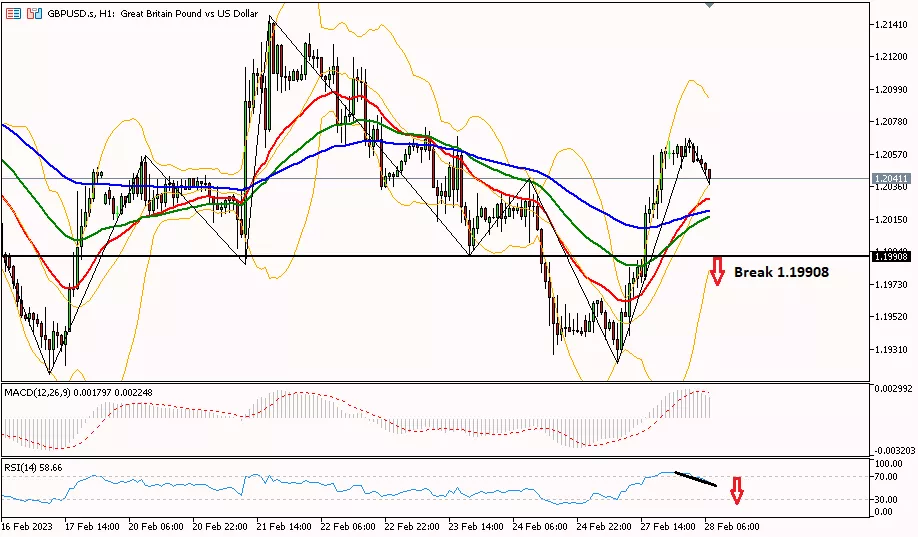
GBP/USD on the 1-hour period entered the consolidation phase testing the support area at 1.19908. If it can be crossed, then the bearish bias will continue until the 1.19350 support level. Downward support can be seen from the RSI indicator which is already in the oversold area. Meanwhile, to continue the bullish bias, the GBP/USD pair must first cross the resistance level of 1.20780, heading towards the next resistance at 1.21430.
Suggest : Sell 1.19910 TP1 1.19350 TP2 1.19000 SL 1.20780
|
PREVIOUS RANGE |
||||||
|
OPEN |
HIGH |
LOW |
CLOSE |
PREV.CLOSE |
CHANGE |
%CHANGE |
|
1.19495 |
1.20652 |
1.19218 |
1.20618 |
1.19412 |
0.01206 |
1.01% |
|
DAILY PIVOT POINT |
||||||
|
R3 |
R2 |
R1 |
PIVOT |
S1 |
S2 |
S3 |
|
1.22220 |
1.21430 |
1.20780 |
1.20000 |
1.19350 |
1.18570 |
1.17910 |
AUDUSD
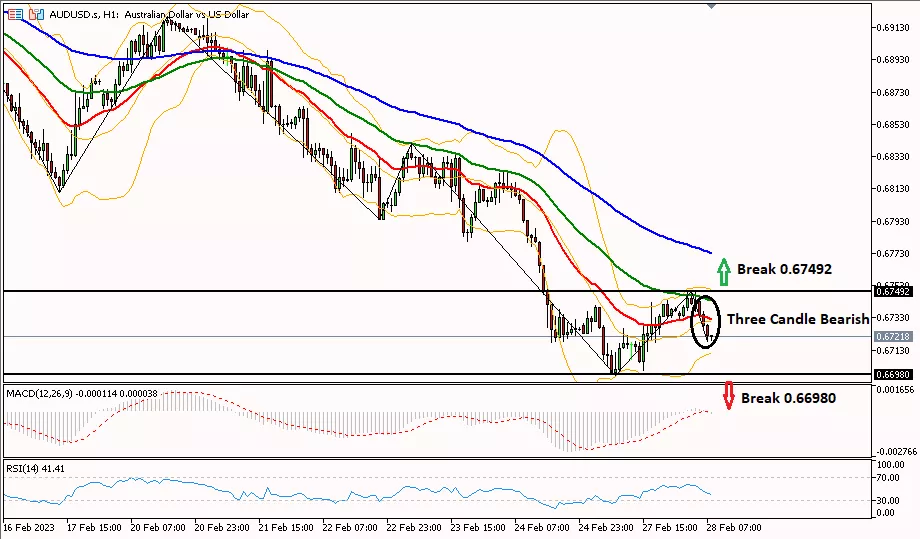
AUD/USD on the 1-hour period is trying to fall further which is seen from the Bearish Three Candle pattern. For further declines, it is necessary to break the 0.66980 area to test the next support at 0.66630. As for the bullish bias, AUD/USD needs to break the 0.67492 resistance first, testing the next resistance at 0.67740.
Suggest : Sell 0.67100-0.66980 TP1 0.66630 TP2 0.66400 SL 0.67492
|
PREVIOUS RANGE |
||||||
|
OPEN |
HIGH |
LOW |
CLOSE |
PREV.CLOSE |
CHANGE |
%CHANGE |
|
0.67284 |
0.67440 |
0.66974 |
0.67376 |
0.67256 |
0.00120 |
0.18% |
|
DAILY PIVOT POINT |
||||||
|
R3 |
R2 |
R1 |
PIVOT |
S1 |
S2 |
S3 |
|
0.68030 |
0.67740 |
0.67570 |
0.67270 |
0.67100 |
0.66800 |
0.66630 |
USDCHF
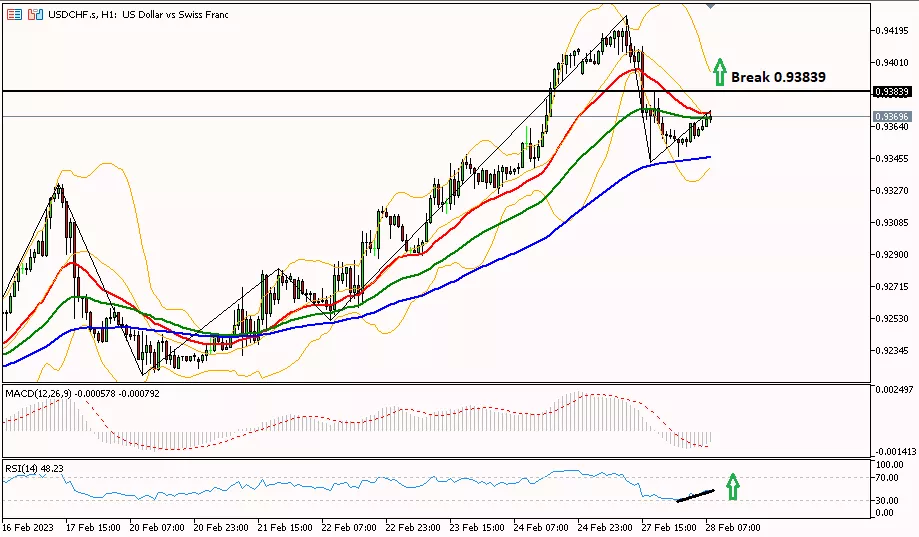
USD/CHF in the 1-hour period was observed moving upwards which was confirmed with the RSI already in the oversold area, testing the resistance area at 0.93839. If it can be crossed, then the bullish bias will continue until the resistance level of 0.94190. Meanwhile, to turn the bias bearish, the USD/CHF pair must first pass the support level of 0.93340, heading to the next support at 0.92960.
Suggest : Buy 0.93839 TP1 0.94190 TP2 0.94660 SL 0.93340
|
PREVIOUS RANGE |
||||||
|
OPEN |
HIGH |
LOW |
CLOSE |
PREV.CLOSE |
CHANGE |
%CHANGE |
|
0.93944 |
0.94280 |
0.93433 |
0.93568 |
0.94086 |
-0.00518 |
-0.55% |
|
DAILY PIVOT POINT |
||||||
|
R3 |
R2 |
R1 |
PIVOT |
S1 |
S2 |
S3 |
|
0.95030 |
0.94660 |
0.94190 |
0.93810 |
0.93340 |
0.92960 |
0.92490 |
USDJPY
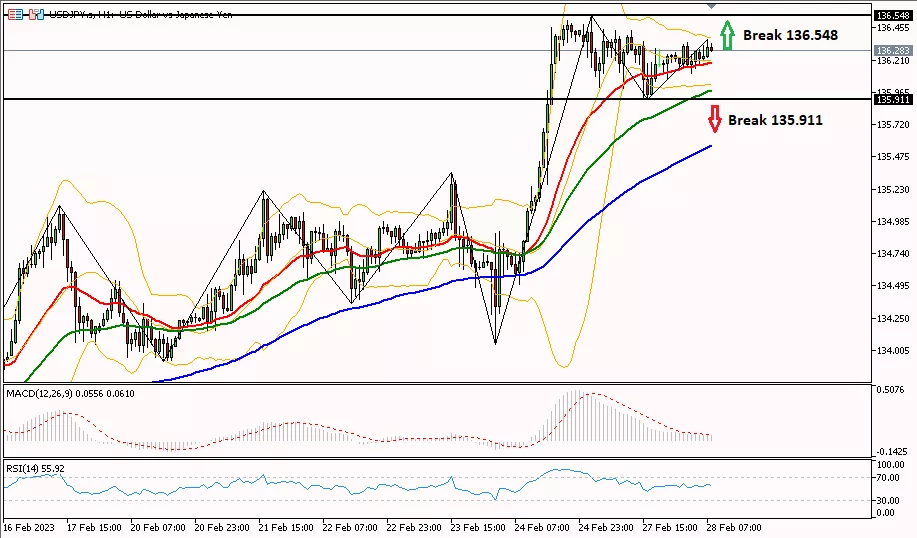
USD/JPY on the 1-hour period tried to rise further, testing the resistance level at 136,548 until heading to the next resistance at 136,910. As for the bearish bias, USD/JPY needs to break the 135.911 support first, testing the next support at 135.630.
Suggest : Buy 136.548 TP1 136.910 TP2 137.260 SL 135.911
|
PREVIOUS RANGE |
||||||
|
OPEN |
HIGH |
LOW |
CLOSE |
PREV.CLOSE |
CHANGE |
%CHANGE |
|
136.398 |
136.548 |
135.912 |
136.221 |
136.432 |
-0.211 |
-0.15% |
|
DAILY PIVOT POINT |
||||||
|
R3 |
R2 |
R1 |
PIVOT |
S1 |
S2 |
S3 |
|
137.260 |
136.910 |
136.630 |
136.270 |
135.990 |
135.630 |
135.360 |
XUL (LOCO LONDON GOLD)
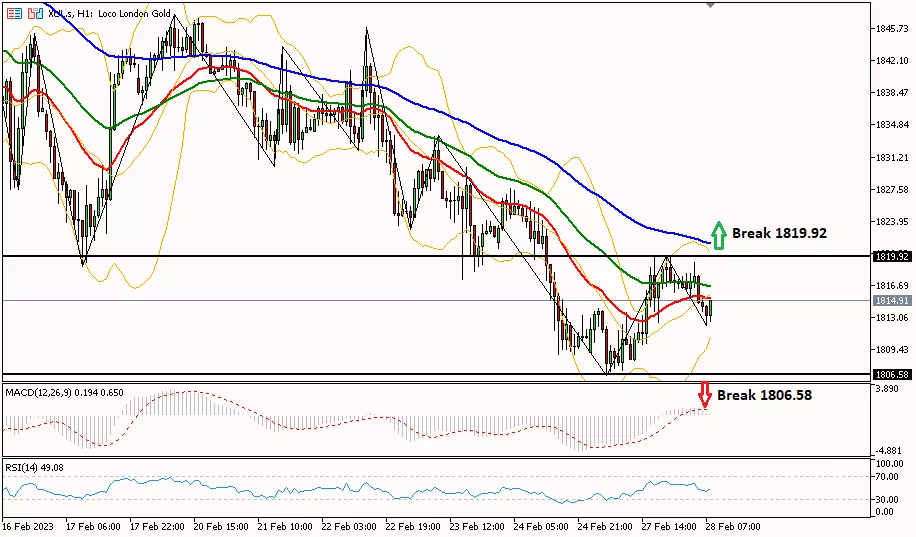
Gold prices in the 1-hour period are still in a downtrend, trying to rebound to test the resistance level in the area of 1819.92 to the next resistance at 1826.60. Meanwhile, to continue the bearish trend, gold needs to pass the support of 1806.58 first to the next support at 1799.60.
Suggest : Sell 1810.00-1806.58 TP1 1799.60 TP2 1792.70 SL 1819.92
|
PREVIOUS RANGE |
||||||
|
OPEN |
HIGH |
LOW |
CLOSE |
PREV.CLOSE |
CHANGE |
%CHANGE |
|
1809.08 |
1819.98 |
1806.48 |
1816.92 |
1810.91 |
6.01 |
0.33% |
|
DAILY PIVOT POINT |
||||||
|
R3 |
R2 |
R1 |
PIVOT |
S1 |
S2 |
S3 |
|
1833.20 |
1826.60 |
1819.70 |
1813.10 |
1806.20 |
1799.60 |
1792.70 |
CLSK (OIL)
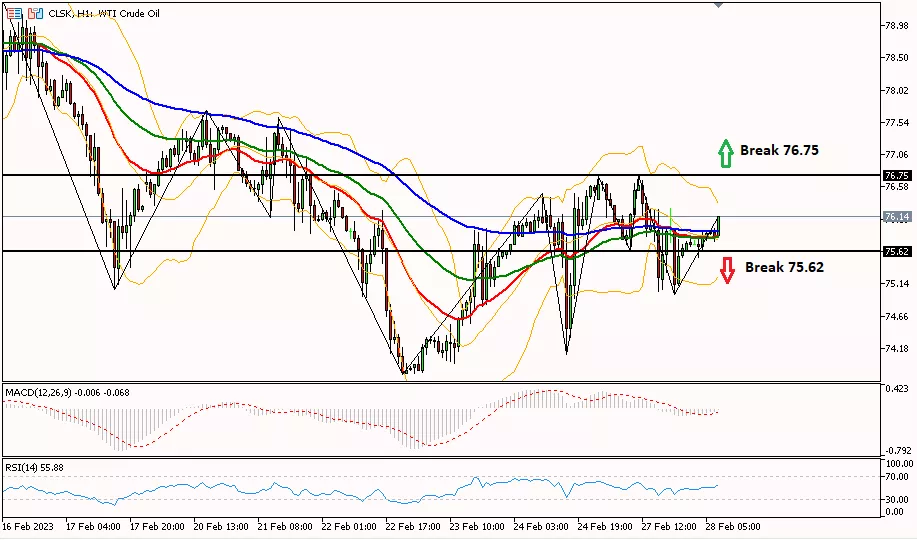
Oil prices in the 1-hour period tried to move up, testing the resistance level in the area of 76.75 to testing the next resistance at 77.62. Meanwhile, to change the bias to bearish, the oil price needs to pass the support of 75.62 first to the next support at 74.89.
Suggest : Buy 76.75 TP1 77.62 TP2 78.00 SL 75.62
|
PREVIOUS RANGE |
||||||
|
OPEN |
HIGH |
LOW |
CLOSE |
PREV.CLOSE |
CHANGE |
%CHANGE |
|
76.40 |
76.77 |
74.98 |
75.74 |
76.53 |
-0.79 |
-1.03% |
|
DAILY PIVOT POINT |
||||||
|
R3 |
R2 |
R1 |
PIVOT |
S1 |
S2 |
S3 |
|
78.47 |
77.62 |
76.68 |
75.83 |
74.89 |
74.04 |
73.10 |
So, that's the explanation of the "Technical Daily Analysis: February 28, 2023 – Greenback on Fire". Also read our other articles, such as an explanation of how to buy cryptocurrencies, only in the GIC Journal. Don't forget to practice your trading skills by getting the Scalping Ebook and following Live Trading on NFP Live Trading. Make sure, download GIC Mobile Apps on the Google Play Store.
Warning!
This analysis is based on fundamental and technical views from reliable sources, and is not a suggestion or invitation. Always remember that this content aims to enrich the reader's information. Always use independent research first on other forex information to use as a reference in your trading.
Update other forex news through the GIC Journal every day to find out the latest updates about the world of forex to crypto. Also trade on GICTrade using an ECN account to enjoy trading with low spreads starting from zero!