 Last:
Last: 
Here is the technical daily analysis for May 17, 2024. The data and analysis in this bulletin can be widely used for your trading. However, it is important to note that GICTrade and the data providers are not responsible for your trading results.
We will provide forecasts for price movements in Forex and commodities, complete with calculations for pivot points, resistance, and support levels.
AUDUSD
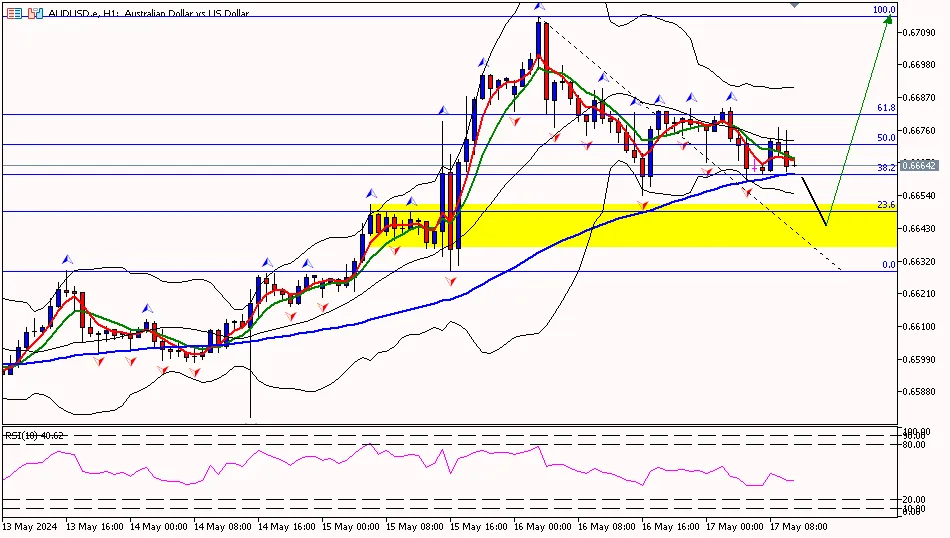
AUD/USD on the 1-hour timeframe is trading below the pivot area at 0.66840, attempting to move down towards the first support area at 0.66540 and then towards the second support area at 0.66240. Meanwhile, the RSI indicator is below the pivot area, indicating that the Aussie has the potential to move lower further.
Suggest: Sell 0.66700 TP1 0.66500 TP2 0.66300 SL 0.66900
XAUUSD (LOCO LONDON GOLD)
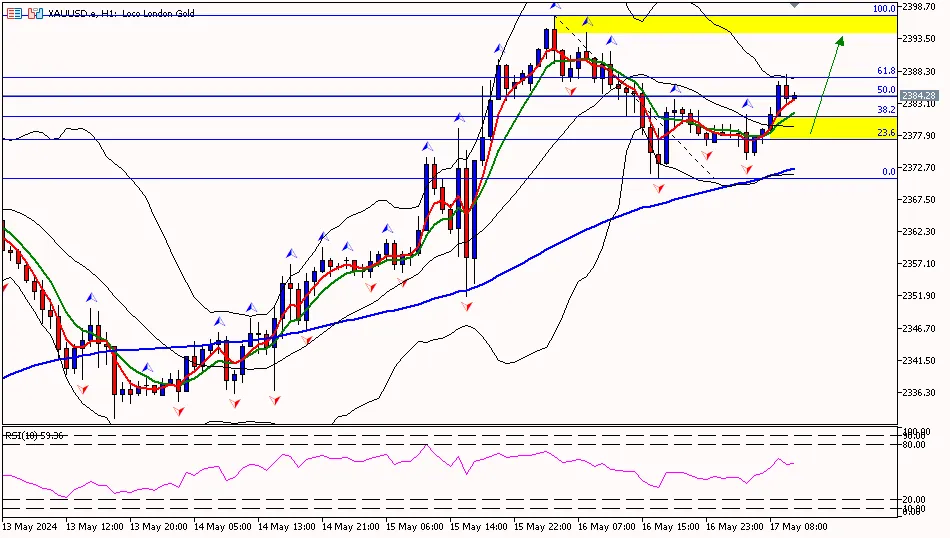
Gold on the 1-hour timeframe is trading above the pivot area at 2382.90, attempting to move up towards the first resistance area at 2394.80 and then towards the second resistance area at 2409.30. Meanwhile, the RSI indicator is above the pivot area, indicating that gold has the potential to move higher further.
Suggest: Buy 2380.00 TP1 2385.00 TP2 2395.00 SL 2375.00
CLSK (OIL)
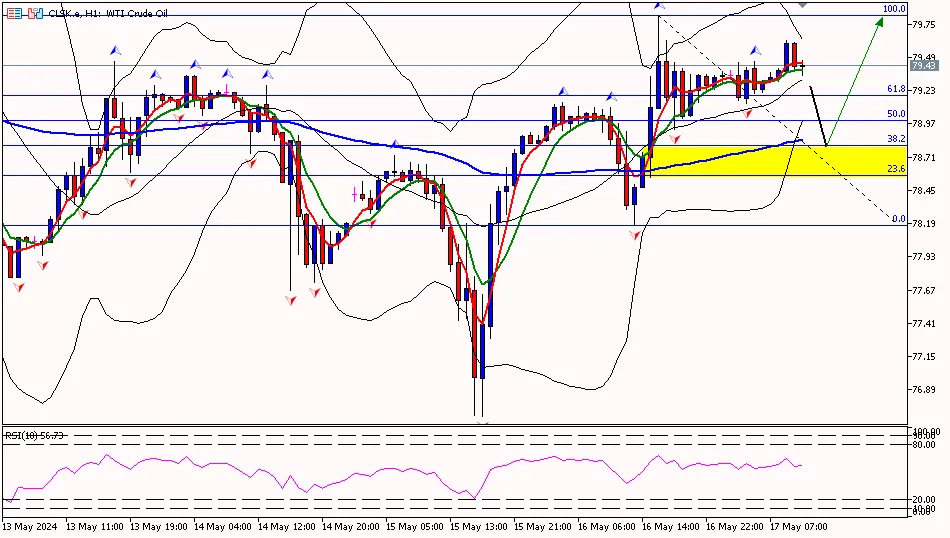
Oil on the 1-hour timeframe is trading above the pivot area at 79.11, with the potential to move up to the first resistance area at 80.04 and then towards the second resistance area at 80.75. Meanwhile, the RSI indicator is above the pivot area, indicating that oil has the potential to move higher further.
Suggest: Buy 78.50 TP1 79.00 TP2 79.50 SL 78.00
So, that's the explanation for "Technical Daily Analysis: May 17, 2024 – US Dollar Rebounds." Also, check out our other articles, such as explanations on how to buy cryptocurrency, only on Jurnal GIC. Don’t forget to sharpen your trading skills by getting the Scalping Guide ebook. Make sure to download the GIC Mobile App from the Google Play Store.
AUDUSD
AUD/USD on the 1-hour timeframe is trading below the pivot area at 0.66840, attempting to move down towards the first support area at 0.66540 and then towards the second support area at 0.66240. Meanwhile, the RSI indicator is below the pivot area, indicating that the Aussie has the potential to move lower further.
Suggest: Sell 0.66700 TP1 0.66500 TP2 0.66300 SL 0.66900
|
PREVIOUS RANGE |
||||||
|
OPEN |
HIGH |
LOW |
CLOSE |
PREV.CLOSE |
CHANGE |
%CHANGE |
|
0.66879 |
0.67142 |
0.66541 |
0.66786 |
0.66933 |
-0.00147 |
-0.22% |
|
DAILY PIVOT POINT |
||||||
|
R3 |
R2 |
R1 |
PIVOT |
S1 |
S2 |
S3 |
|
0.67740 |
0.67440 |
0.67140 |
0.66840 |
0.66540 |
0.66240 |
0.65940 |
XAUUSD (LOCO LONDON GOLD)
Gold on the 1-hour timeframe is trading above the pivot area at 2382.90, attempting to move up towards the first resistance area at 2394.80 and then towards the second resistance area at 2409.30. Meanwhile, the RSI indicator is above the pivot area, indicating that gold has the potential to move higher further.
Suggest: Buy 2380.00 TP1 2385.00 TP2 2395.00 SL 2375.00
|
PREVIOUS RANGE |
||||||
|
OPEN |
HIGH |
LOW |
CLOSE |
PREV.CLOSE |
CHANGE |
%CHANGE |
|
2386.22 |
2397.37 |
2370.98 |
2377.16 |
2387.87 |
-10.71 |
-0.45% |
|
DAILY PIVOT POINT |
||||||
|
R3 |
R2 |
R1 |
PIVOT |
S1 |
S2 |
S3 |
|
2421.20 |
2409.30 |
2394.80 |
2382.90 |
2368.40 |
2356.50 |
2342.00 |
CLSK (OIL)
Oil on the 1-hour timeframe is trading above the pivot area at 79.11, with the potential to move up to the first resistance area at 80.04 and then towards the second resistance area at 80.75. Meanwhile, the RSI indicator is above the pivot area, indicating that oil has the potential to move higher further.
Suggest: Buy 78.50 TP1 79.00 TP2 79.50 SL 78.00
|
PREVIOUS RANGE |
||||||
|
OPEN |
HIGH |
LOW |
CLOSE |
PREV.CLOSE |
CHANGE |
%CHANGE |
|
78.82 |
79.82 |
78.18 |
79.33 |
78.82 |
0.51 |
0.65% |
|
DAILY PIVOT POINT |
||||||
|
R3 |
R2 |
R1 |
PIVOT |
S1 |
S2 |
S3 |
|
81.68 |
80.75 |
80.04 |
79.11 |
78.40 |
77.47 |
|
So, that's the explanation for "Technical Daily Analysis: May 17, 2024 – US Dollar Rebounds." Also, check out our other articles, such as explanations on how to buy cryptocurrency, only on Jurnal GIC. Don’t forget to sharpen your trading skills by getting the Scalping Guide ebook. Make sure to download the GIC Mobile App from the Google Play Store.


