 Last:
Last: 
The following is a technical daily analysis, March 3, 2023. The data and analysis contained in this newsletter can be used on a wide scale for your trading. However, it is important to note that GICTrade and its data providers are not responsible for your trading results.
So, it's your own responsibility. Before knowing today's technical analysis, immediately register yourself to take part in the GIC Gebyar Prize and get the main prize, namely Mobile Mitshubshi Expander or Vacation Package to Labuan Bajo for 4 days and 3 nights.
In the following, we will inform you about the forecast of price movements in Forex and Commodities which is equipped with the calculation of Pivot points, Resistance and Support levels.
EURUSD

Daily Technical Analysis for the EUR/USD pair on the 1-hour period moved upwards trying to touch the resistance area of 1.06450 to turn its bias to bullish until the next resistance at 1.06800. As for further bearishness, EUR/USD needs to break through the support area at 1.05815 towards the next support level at 1.05320.
Suggest : Buy 1.06450 TP1 1.06800 TP2 1.07240 SL 1.05815
|
PREVIOUS RANGE |
||||||
|
OPEN |
HIGH |
LOW |
CLOSE |
PREV.CLOSE |
CHANGE |
%CHANGE |
|
1.06683 |
1.06721 |
1.05758 |
1.05965 |
1.06683 |
-0.00718 |
-0.67% |
|
DAILY PIVOT POINT |
||||||
|
R3 |
R2 |
R1 |
PIVOT |
S1 |
S2 |
S3 |
|
1.07770 |
1.07240 |
1.06800 |
1.06280 |
1.05840 |
1.05320 |
1.04880 |
GBPUSD
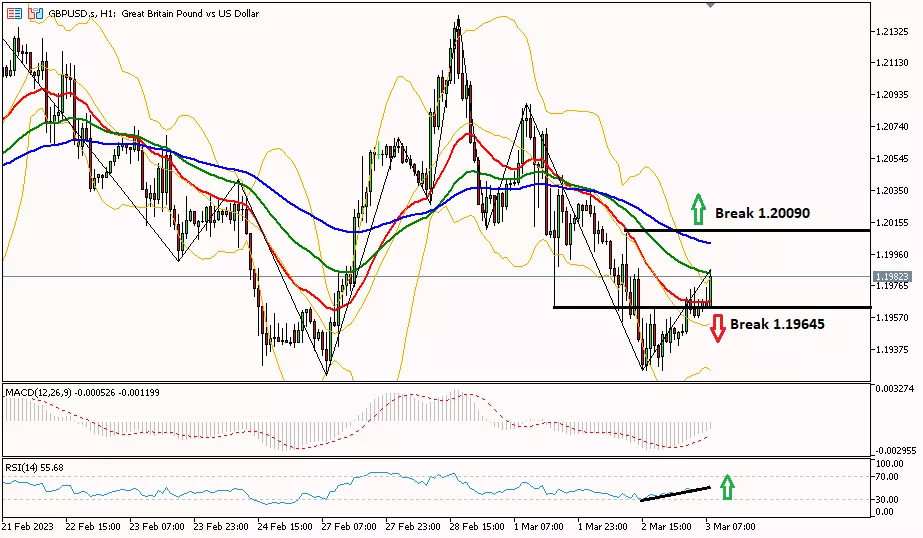
GBP/USD on the 1-hour period moved up, trying to touch the resistance area of 1.20090 to turn its bias bullish towards the next resistance level at 1.20420. As for further bearishness, GBP/USD needs to break through the support area at 1.19645 towards the next support level at 1.19300.
Suggest : Buy 1.20090 TP1 1.20420 TP2 1.20940 SL 1.19645
|
PREVIOUS RANGE |
||||||
|
OPEN |
HIGH |
LOW |
CLOSE |
PREV.CLOSE |
CHANGE |
%CHANGE |
|
1.20260 |
1.20357 |
1.19245 |
1.19472 |
1.20262 |
-0.00790 |
-0.66% |
|
DAILY PIVOT POINT |
||||||
|
R3 |
R2 |
R1 |
PIVOT |
S1 |
S2 |
S3 |
|
1.21530 |
1.20940 |
1.20420 |
1.19830 |
1.19300 |
1.18720 |
1.18190 |
AUDUSD

AUD/USD on the 1-hour period moved upwards trying to touch the resistance area of 0.67825 to turn its bias bullish towards the next resistance level at 0.68340. As for further bearishness, AUD/USD needs to cross the support area at 0.67180 towards the next support level at 0.66810.
Suggest : Buy 0.67825 TP1 0.68100 TP2 0.68340 SL 0.67400
|
PREVIOUS RANGE |
||||||
|
OPEN |
HIGH |
LOW |
CLOSE |
PREV.CLOSE |
CHANGE |
%CHANGE |
|
0.67583 |
0.67651 |
0.67058 |
0.67293 |
0.67581 |
-0.00288 |
-0.43% |
|
DAILY PIVOT POINT |
||||||
|
R3 |
R2 |
R1 |
PIVOT |
S1 |
S2 |
S3 |
|
0.68340 |
0.67990 |
0.67740 |
0.67400 |
0.67150 |
0.66810 |
0.66560 |
USDCHF

USD/CHF on the 1-hour period moved down, trying to touch the 0.93750 support area to turn its bias bearish until it heads to the next support level at 0.93440. As for further bullishness, USD/CHF needs to break through the resistance area at 0.94280 towards the next resistance level at 0.94720.
Suggest : Sell 0.93750 TP1 0.93440 TP2 0.93130 SL 0.94080
|
PREVIOUS RANGE |
||||||
|
OPEN |
HIGH |
LOW |
CLOSE |
PREV.CLOSE |
CHANGE |
%CHANGE |
|
0.93944 |
0.94392 |
0.93751 |
0.94224 |
0.93960 |
0.00264 |
0.28% |
|
DAILY PIVOT POINT |
||||||
|
R3 |
R2 |
R1 |
PIVOT |
S1 |
S2 |
S3 |
|
0.95050 |
0.94720 |
0.94410 |
0.94080 |
0.93770 |
0.93440 |
0.93130 |
USDJPY

Daily technical analysis for the USD/JPY pair on a 1-hour period moved downwards trying to touch the 136.210 support area to turn its bias bearish towards the next support level at 135.910. As for further bulls, USD/JPY needs to break through the resistance area at 136,910 towards the next resistance level at 137,570.
Suggest : Sell 136.210 TP1 135.910 TP2 135.430 SL 136.500
|
PREVIOUS RANGE |
||||||
|
OPEN |
HIGH |
LOW |
CLOSE |
PREV.CLOSE |
CHANGE |
%CHANGE |
|
136.162 |
137.088 |
136.016 |
136.747 |
136.185 |
0.562 |
0.41% |
|
DAILY PIVOT POINT |
||||||
|
R3 |
R2 |
R1 |
PIVOT |
S1 |
S2 |
S3 |
|
138.060 |
137.570 |
136.980 |
136.500 |
135.910 |
135.430 |
134.840 |
XUL (LOCO LONDON GOLD)

Gold prices in the 1-hour period are trying to move further up, towards the resistance level of 1845.91 to resistance 1849.30. Meanwhile, to change the bias to bearish again, the gold price needs to pass the nearest support level at 1836.00 to reach the next support at 1831.40.
Suggest : Sell 1846.00-1849.00 TP1 1840.00 TP2 1836.00 SL 1855.00
|
PREVIOUS RANGE |
||||||
|
OPEN |
HIGH |
LOW |
CLOSE |
PREV.CLOSE |
CHANGE |
%CHANGE |
|
1836.30 |
1838.82 |
1829.85 |
1835.32 |
1837.10 |
-1.78 |
-0.10% |
|
DAILY PIVOT POINT |
||||||
|
R3 |
R2 |
R1 |
PIVOT |
S1 |
S2 |
S3 |
|
1849.30 |
1844.10 |
1840.40 |
1835.10 |
1831.40 |
1826.10 |
1822.40 |
CLSK (OIL)

Daily technical analysis for oil prices on the 1-hour period moves a correction testing the 77.20 support area towards the next support level at 76.54. Meanwhile, for a bullish bias, oil prices need to pass the resistance level of 78.57 to the next resistance at 79.26.
Suggest : Sell 77.20 TP1 76.54 TP2 75.87 SL 77.90
|
PREVIOUS RANGE |
||||||
|
OPEN |
HIGH |
LOW |
CLOSE |
PREV.CLOSE |
CHANGE |
%CHANGE |
|
77.72 |
78.57 |
77.21 |
77.91 |
77.66 |
0.25 |
0.32% |
|
DAILY PIVOT POINT |
||||||
|
R3 |
R2 |
R1 |
PIVOT |
S1 |
S2 |
S3 |
|
79.95 |
79.26 |
78.59 |
77.90 |
77.23 |
76.54 |
75.87 |


