 Last:
Last: 
Here is the technical daily analysis for March 14, 2024. The data and analysis in this bulletin can be used broadly for your trading. However, it is important to note that GICTrade and data providers are not responsible for your trading results.
We will provide forecasts for price movements in Forex and Commodities, along with calculations of Pivot points, Resistance, and Support levels.
EURUSD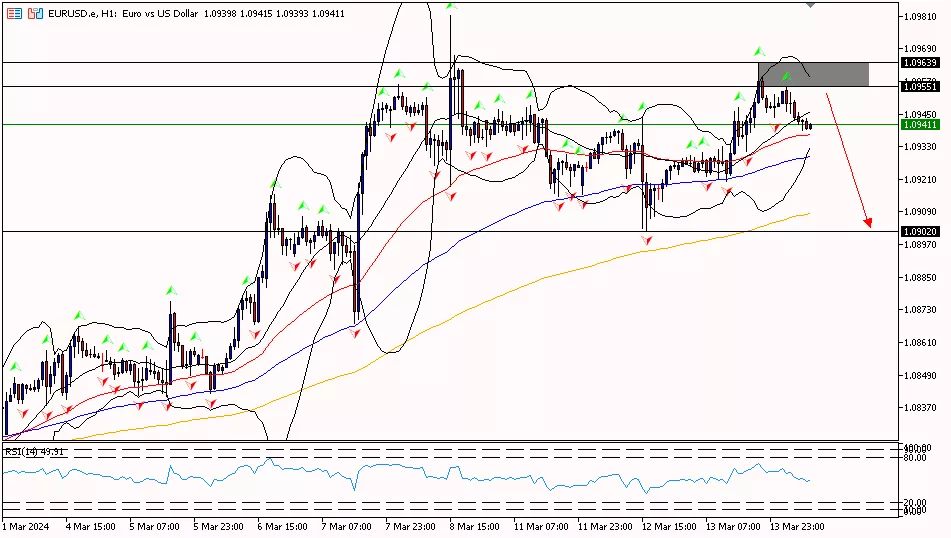
EUR/USD on the 1-hour timeframe is below the first resistance area at 1.09580, attempting to move down to the pivot area at 1.09390, heading towards the first support at 1.09140. Meanwhile, the RSI indicator is below the pivot area, suggesting that the Euro may continue to move downward.
Suggest: Sell 1.09580 TP1 1.09390 TP2 1.09140 SL 1.09830
|
PREVIOUS RANGE |
||||||
|
OPEN |
HIGH |
LOW |
CLOSE |
PREV.CLOSE |
CHANGE |
%CHANGE |
|
1.09247 |
1.09639 |
1.09201 |
1.09479 |
1.09261 |
0.00218 |
0.20% |
|
DAILY PIVOT POINT |
||||||
|
R3 |
R2 |
R1 |
PIVOT |
S1 |
S2 |
S3 |
|
1.10020 |
1.09830 |
1.09580 |
1.09390 |
1.09140 |
1.08950 |
1.08700 |
GBPUSD
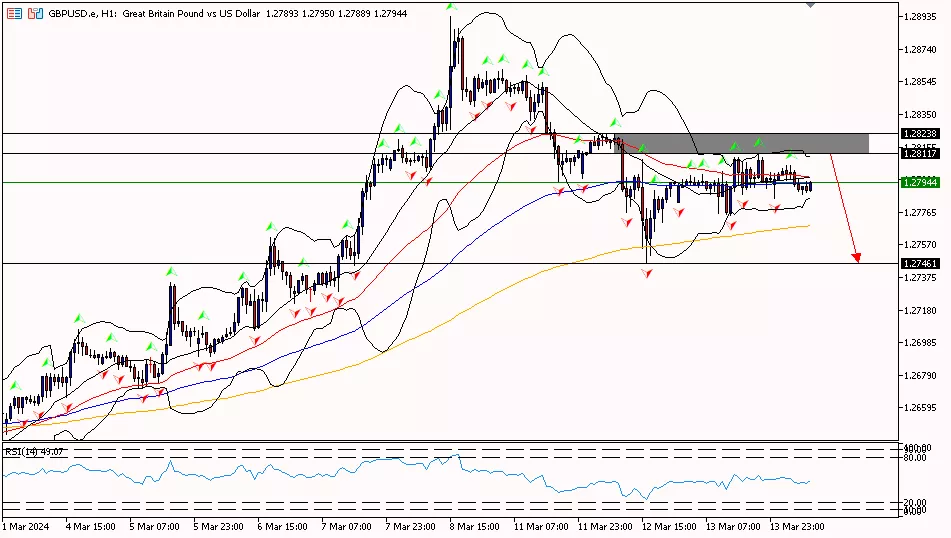
GBP/USD on the 1-hour timeframe is below the first resistance area at 1.28070, attempting to move down to the pivot area at 1.27910, heading towards the first support at 1.27710. Meanwhile, the RSI indicator is below the pivot area, suggesting that the Pound Sterling may continue to move downward.
Suggest: Sell 1.28100 TP1 1.27900 TP2 1.27700 SL 1.28300
|
PREVIOUS RANGE |
||||||
|
OPEN |
HIGH |
LOW |
CLOSE |
PREV.CLOSE |
CHANGE |
%CHANGE |
|
1.27823 |
1.28114 |
1.27746 |
1.27969 |
1.27935 |
0.00034 |
0.03% |
|
DAILY PIVOT POINT |
||||||
|
R3 |
R2 |
R1 |
PIVOT |
S1 |
S2 |
S3 |
|
1.28440 |
1.28280 |
1.28070 |
1.27910 |
1.27710 |
1.27540 |
1.27340 |
AUDUSD
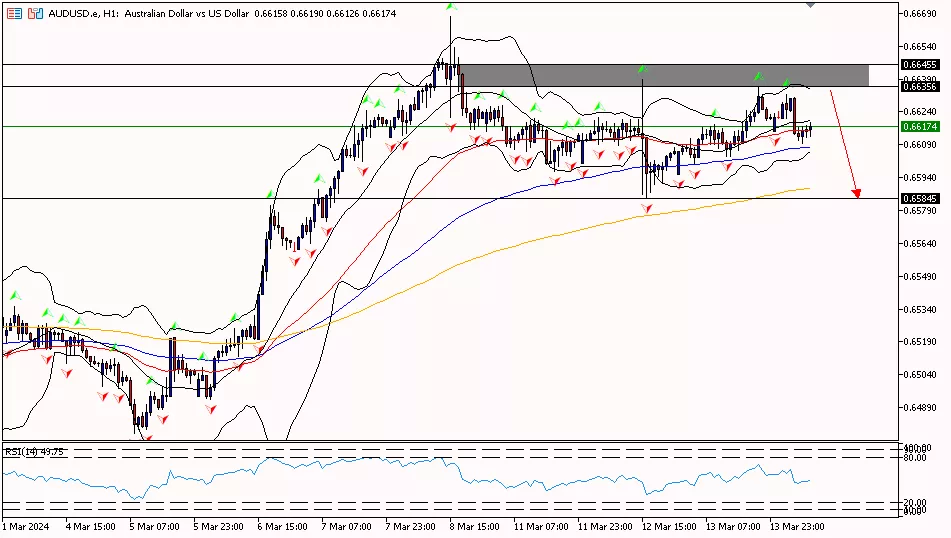
AUD/USD on the 1-hour timeframe is below the first resistance area at 0.66290, attempting to move down to the pivot area at 0.66120, heading towards the first support area at 0.65890. Meanwhile, the RSI indicator is below the pivot area, suggesting that the Aussie Dollar may have the potential to move downward.
Suggest: Sell 0.66300 TP1 0.66100 TP2 0.65890 SL 0.66520
|
PREVIOUS RANGE |
||||||
|
OPEN |
HIGH |
LOW |
CLOSE |
PREV.CLOSE |
CHANGE |
%CHANGE |
|
0.65954 |
0.66352 |
0.65954 |
0.66215 |
0.66058 |
0.00157 |
0.24% |
|
DAILY PIVOT POINT |
||||||
|
R3 |
R2 |
R1 |
PIVOT |
S1 |
S2 |
S3 |
|
0.66680 |
0.66520 |
0.66290 |
0.66120 |
0.65890 |
0.65720 |
0.65490 |
USDCHF
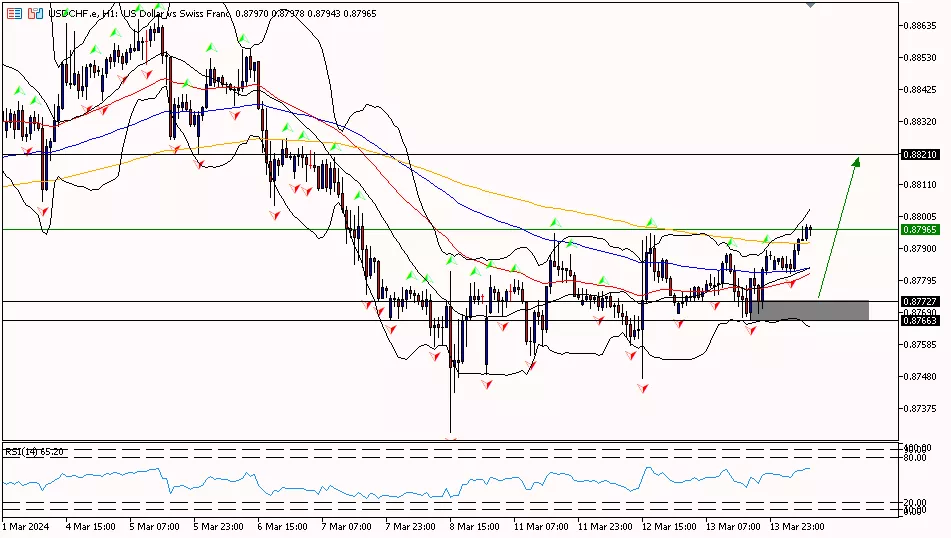
USD/CHF on the 1-hour timeframe is above the pivot area at 0.87780, attempting to rise to the first resistance area at 0.87900 and then towards the second resistance at 0.88010. Meanwhile, the RSI indicator is above the pivot area, suggesting that the Swiss Franc may have the potential to move upward.
Suggest: Buy 0.87700 TP1 0.87900 TP2 0.88100 SL 0.87500
|
PREVIOUS RANGE |
||||||
|
OPEN |
HIGH |
LOW |
CLOSE |
PREV.CLOSE |
CHANGE |
%CHANGE |
|
0.87687 |
0.87896 |
0.87663 |
0.87879 |
0.87723 |
0.00156 |
0.18% |
|
DAILY PIVOT POINT |
||||||
|
R3 |
R2 |
R1 |
PIVOT |
S1 |
S2 |
S3 |
|
0.88130 |
0.88010 |
0.87900 |
0.87780 |
0.87660 |
0.87550 |
0.87430 |
USDJPY
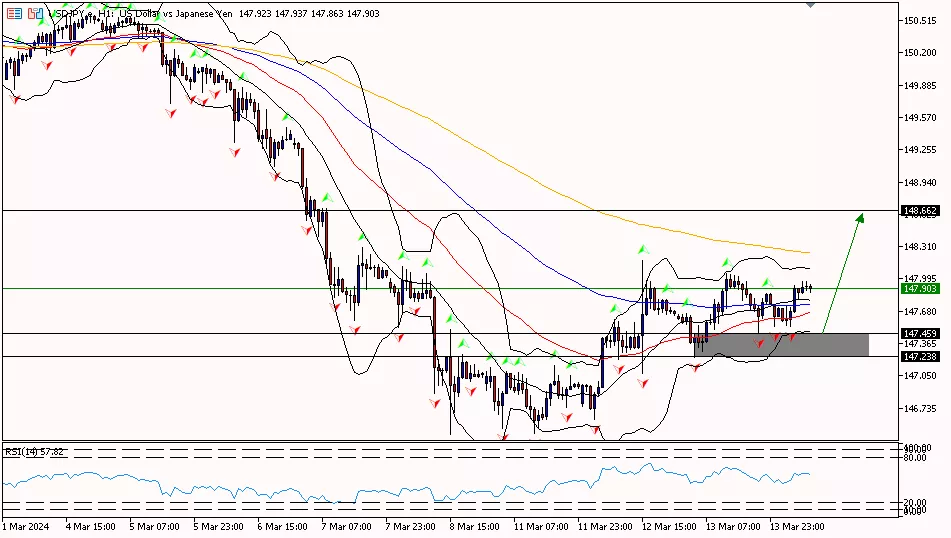
USD/JPY on the 1-hour timeframe is above the pivot area at 147.670, attempting to move up towards the first resistance area at 148.110 and then towards the second resistance at 148.480. Meanwhile, the RSI indicator is above the pivot area, suggesting that the Yen may have the potential to move upward or rebound.
Suggest: Buy 147.670 TP1 148.110 TP2 148.480 SL 147.300
|
PREVIOUS RANGE |
||||||
|
OPEN |
HIGH |
LOW |
CLOSE |
PREV.CLOSE |
CHANGE |
%CHANGE |
|
147.633 |
148.048 |
147.234 |
147.753 |
147.659 |
0.094 |
0.06% |
|
DAILY PIVOT POINT |
||||||
|
R3 |
R2 |
R1 |
PIVOT |
S1 |
S2 |
S3 |
|
148.920 |
148.480 |
148.110 |
147.670 |
147.290 |
146.860 |
146.480 |
XUL (LOCO LONDON GOLD)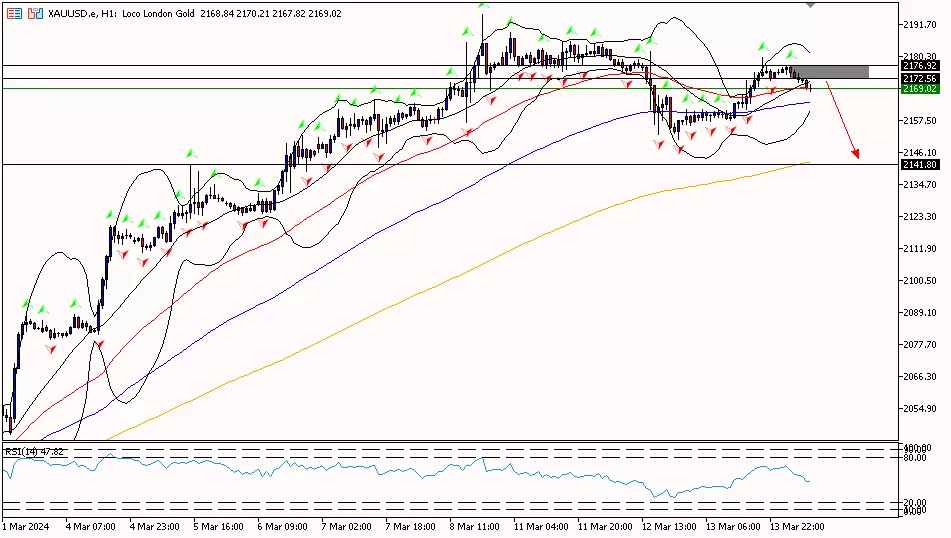
Gold prices on the 1-hour timeframe are below the first resistance area at 2178.40, attempting to move down towards the pivot area at 2154.30, heading towards the first support at 2143.00. Meanwhile, the RSI indicator is below the pivot area, suggesting that gold prices may have the potential to move further downward.
Suggest: Sell 2175.00 TP1 2165.00 TP2 2155.00 SL 2181.00
|
PREVIOUS RANGE |
||||||
|
OPEN |
HIGH |
LOW |
CLOSE |
PREV.CLOSE |
CHANGE |
%CHANGE |
|
2157.97 |
2179.88 |
2155.79 |
2174.57 |
2157.01 |
17.56 |
0.81% |
|
DAILY PIVOT POINT |
||||||
|
R3 |
R2 |
R1 |
PIVOT |
S1 |
S2 |
S3 |
|
2202.50 |
2191.20 |
2178.40 |
2167.10 |
2154.30 |
2143.00 |
2130.20 |
CLSK (OIL)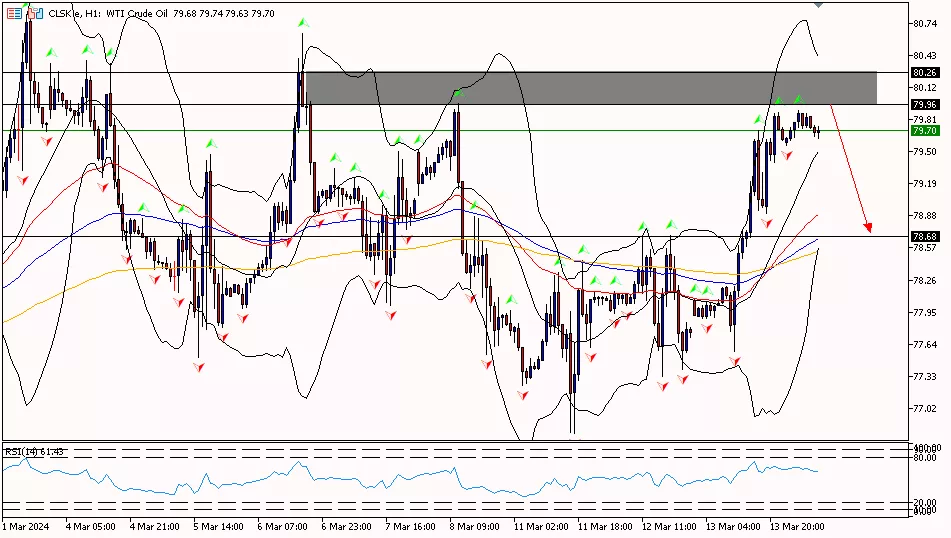
Oil prices on the 1-hour timeframe are below the first resistance area at 80.47, with the potential to move down to the pivot area at 77.02, heading towards the first support at 78.16. Meanwhile, the RSI indicator is above the pivot area, suggesting that oil prices may have the potential to move upward first before declining or correcting.
Suggest: Sell 80.47 TP1 79.50 TP2 79.00 SL 81.00
|
PREVIOUS RANGE |
||||||
|
OPEN |
HIGH |
LOW |
CLOSE |
PREV.CLOSE |
CHANGE |
%CHANGE |
|
78.06 |
79.88 |
77.57 |
79.62 |
77.75 |
1.87 |
2.41% |
|
DAILY PIVOT POINT |
||||||
|
R3 |
R2 |
R1 |
PIVOT |
S1 |
S2 |
S3 |
|
82.78 |
81.33 |
80.47 |
79.02 |
78.16 |
76.71 |
75.85 |
Well, that’s the explanation of “Technical Daily Analysis: March 14, 2024 – US Retail Sales Improve, Dollar Rises.” Also, check out our other articles, such as guides on how to buy cryptocurrency, only at the GIC Journal. Don’t forget to enhance your trading skills by getting the Scalping Ebook guide and joining the Live Trading sessions at NFP Live Trading. Be sure to download the GIC Mobile Apps from the Google Play Store.


