 Last:
Last: 
The following is a technical daily analysis, March 1, 2023. The data and analysis contained in this newsletter can be used on a wide scale for your trading. However, it is important to note that GICTrade and its data providers are not responsible for your trading results.
So, it's your own responsibility. Before knowing today's technical analysis, immediately register yourself to take part in the GIC Gebyar Prize and get the main prize, namely Mobile Mitshubshi Expander or Vacation Package to Labuan Bajo for 4 days and 3 nights.
In the following, we will inform you about the forecast of price movements in Forex and Commodities which is equipped with the calculation of Pivot points, Resistance and Support levels.
EURUSD
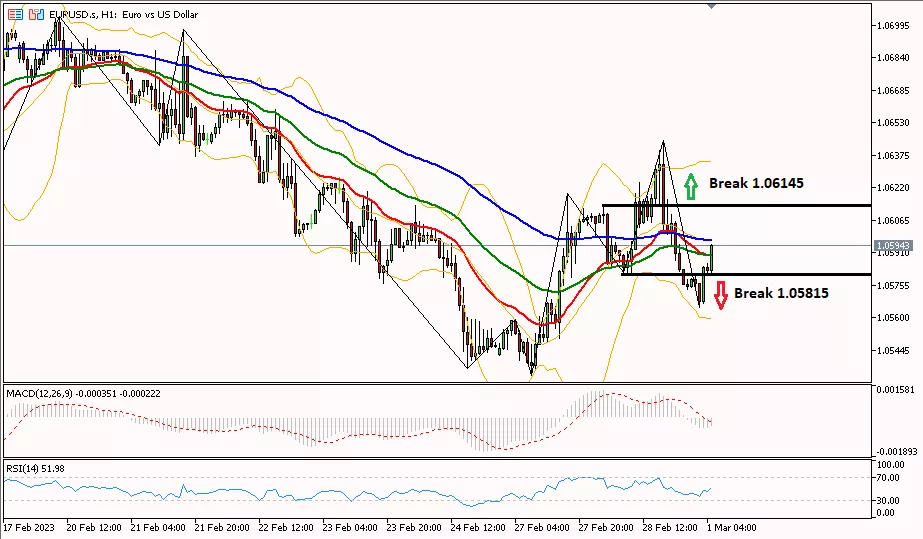
EUR/USD on the 1-hour period rebounded trying to touch the 1.06145 area to turn the bias to bullish until the next resistance at 1.06710. As for further bearishness, EUR/USD needs to break through the 1.05815 area towards the next support level at 1.05290.
Suggest : Sell 1.05815 TP1 1.05560 TP2 1.05815 SL 1.06145
|
PREVIOUS RANGE |
||||||
|
OPEN |
HIGH |
LOW |
CLOSE |
PREV.CLOSE |
CHANGE |
%CHANGE |
|
1.06082 |
1.06444 |
1.05734 |
1.05749 |
1.06081 |
-0.00332 |
-0.31% |
|
DAILY PIVOT POINT |
||||||
|
R3 |
R2 |
R1 |
PIVOT |
S1 |
S2 |
S3 |
|
1.06980 |
1.06710 |
1.06270 |
1.06000 |
1.05560 |
1.05290 |
1.04850 |
GBPUSD
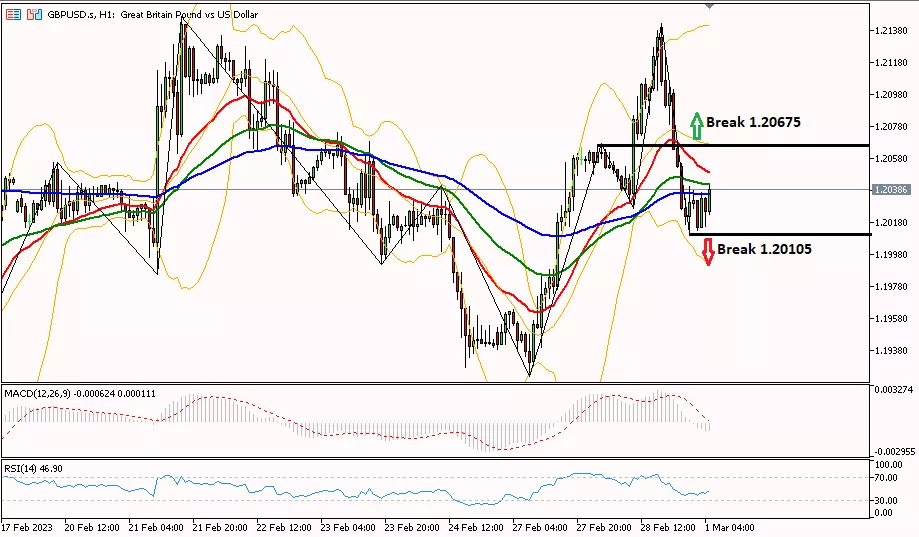
Daily Technical Analysis for the GBP/USD pair on the 1-hour period of the rebound tried to touch the area of 1.20675 to turn the bias to bullish until the next resistance at 1.21050. As for further bearishness, GBP/USD needs to break through the 1.20105 area towards the next support level at 1.19360.
Suggest : Sell 1.20105 TP1 1.19800 TP2 1.19360 SL 1.20675
|
PREVIOUS RANGE |
||||||
|
OPEN |
HIGH |
LOW |
CLOSE |
PREV.CLOSE |
CHANGE |
%CHANGE |
|
1.20617 |
1.21423 |
1.20168 |
1.20217 |
1.20618 |
-0.00401 |
-0.33% |
|
DAILY PIVOT POINT |
||||||
|
R3 |
R2 |
R1 |
PIVOT |
S1 |
S2 |
S3 |
|
1.22310 |
1.21870 |
1.21050 |
1.20610 |
1.19800 |
1.19360 |
1.18540 |
AUDUSD
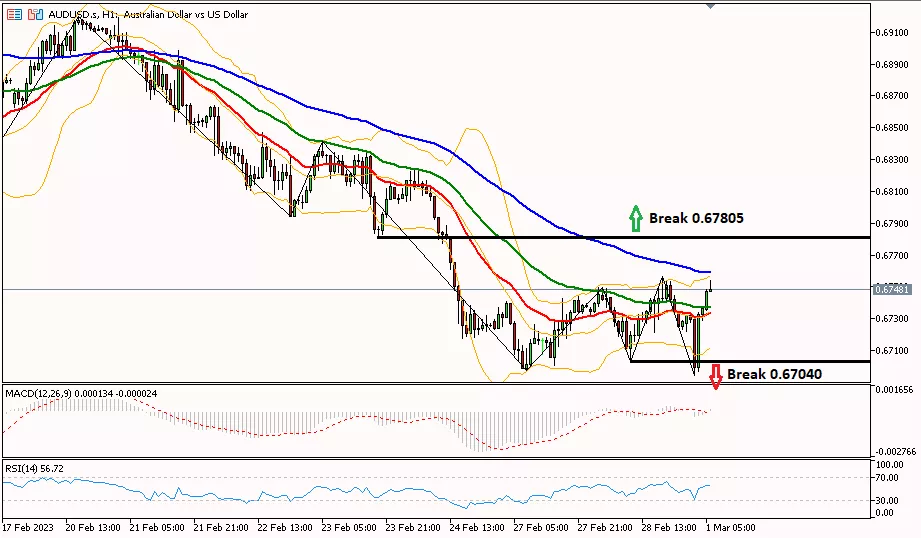
AUD/USD on the 1-hour period rebounded trying to touch the area of 0.67805 to change the bias to bullish until it heads towards the next resistance at 0.68130. As for further bearishness, AUD/USD needs to cross the 0.67040 area towards the next support level at 0.66770.
Suggest : Sell 0.67795-0.67815 TP1 0.67590 TP2 0.67050 SL 0.68130
|
PREVIOUS RANGE |
||||||
|
OPEN |
HIGH |
LOW |
CLOSE |
PREV.CLOSE |
CHANGE |
%CHANGE |
|
0.67359 |
0.67568 |
0.67030 |
0.67280 |
0.67376 |
-0.00096 |
-0.15% |
|
DAILY PIVOT POINT |
||||||
|
R3 |
R2 |
R1 |
PIVOT |
S1 |
S2 |
S3 |
|
0.68130 |
0.67850 |
0.67590 |
0.67310 |
0.67050 |
0.66770 |
0.66510 |
USDCHF
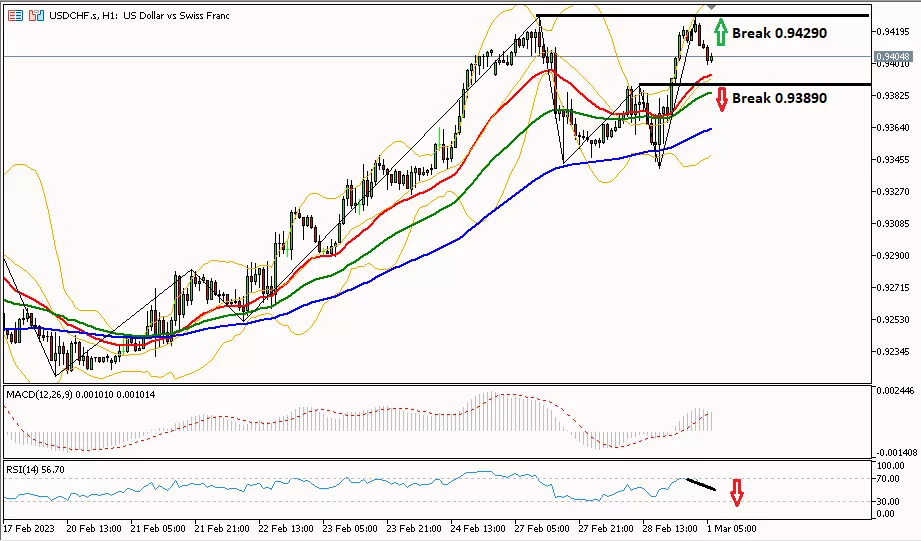
Daily Technical Analysis for USD/CHF on the 1-hour period is trying to move downwards, testing the support level at 0.93890 until heading towards the next support at 0.93480. The decline in USD/CHF is also confirmed by the RSI indicator which is already in the overbought area. As for further bullish bias, it is necessary to cross the 0.94290 resistance area first, to try to test the next resistance at 0.94670.
Suggest : Sell 0.93890 TP1 0.93480 TP2 0.93030 SL 0.94290
|
PREVIOUS RANGE |
||||||
|
OPEN |
HIGH |
LOW |
CLOSE |
PREV.CLOSE |
CHANGE |
%CHANGE |
|
0.93565 |
0.94222 |
0.93405 |
0.94202 |
0.93568 |
0.00634 |
0.67% |
|
DAILY PIVOT POINT |
||||||
|
R3 |
R2 |
R1 |
PIVOT |
S1 |
S2 |
S3 |
|
0.95110 |
0.94670 |
0.94300 |
0.93850 |
0.93480 |
0.93030 |
0.92660 |
USDJPY
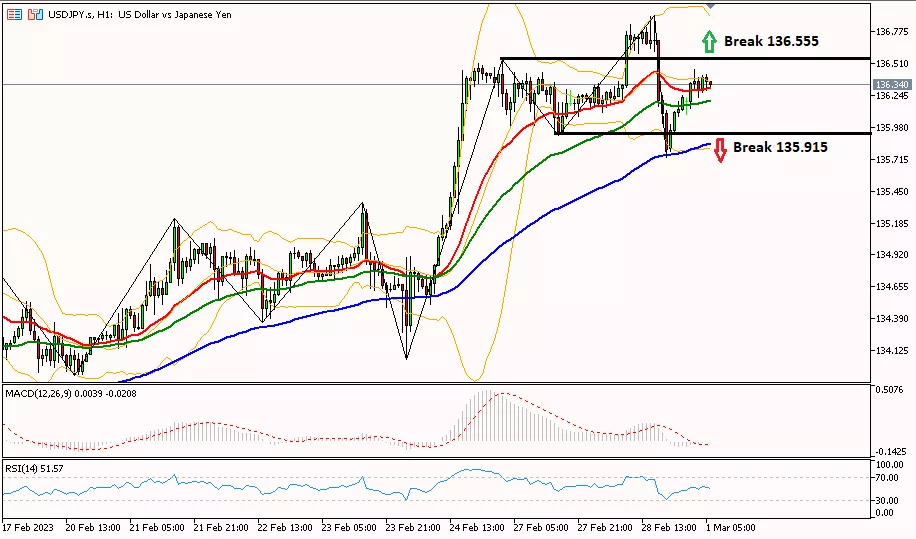
USD/JPY on the 1-hour period tried to rise further, testing the resistance level at 136,555 until heading to the next resistance at 136,810. As for the bearish bias, USD/JPY needs to break the 135.915 support first, testing the next support at 135.630.
Suggest : Buy 136.555 TP1 136.810 TP2 137.450 SL 135.915
|
PREVIOUS RANGE |
||||||
|
OPEN |
HIGH |
LOW |
CLOSE |
PREV.CLOSE |
CHANGE |
%CHANGE |
|
136.221 |
136.909 |
135.731 |
136.229 |
136.221 |
0.008 |
0.01% |
|
DAILY PIVOT POINT |
||||||
|
R3 |
R2 |
R1 |
PIVOT |
S1 |
S2 |
S3 |
|
137.990 |
137.450 |
136.810 |
136.270 |
135.630 |
135.090 |
134.450 |
XUL (LOCO LONDON GOLD)
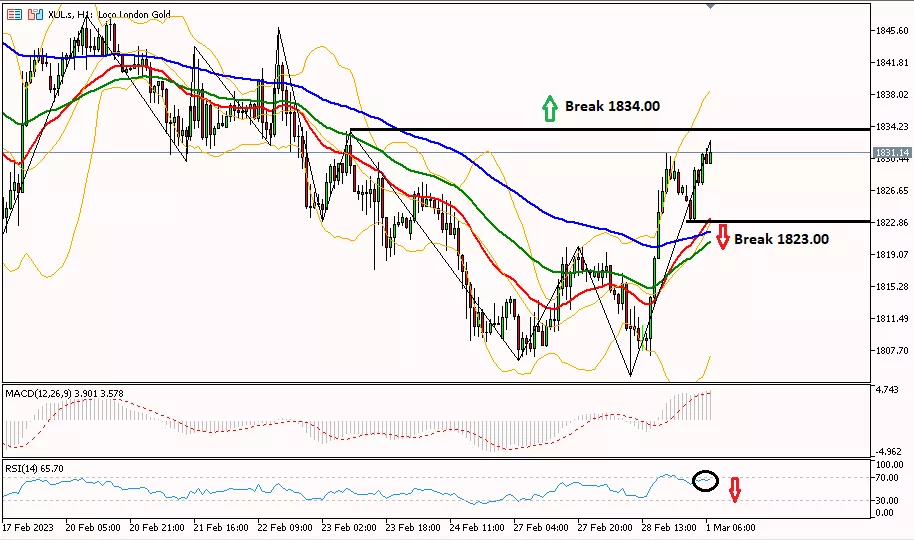
Gold prices in the 1-hour period tried to rebound to test the resistance level in the area of 1834.00 until heading to the next resistance at 1846.10. Meanwhile, to continue the bearish trend, gold needs to pass the 1823.00 support first to test the next support at 1808.40.
Suggest : Sell 1834.00-1836.00 TP1 1825.00 TP2 1819.70 SL 1846.10
|
PREVIOUS RANGE |
||||||
|
OPEN |
HIGH |
LOW |
CLOSE |
PREV.CLOSE |
CHANGE |
%CHANGE |
|
1816.41 |
1831.00 |
1804.63 |
1826.95 |
1816.92 |
10.03 |
0.55% |
|
DAILY PIVOT POINT |
||||||
|
R3 |
R2 |
R1 |
PIVOT |
S1 |
S2 |
S3 |
|
1861.10 |
1846.10 |
1834.80 |
1819.70 |
1808.40 |
1793.30 |
1782.00 |
CLSK (OIL)

Daily Technical Analysis for Oil prices in the 1-hour period tried to move further up, testing the resistance level in the area of 77.80 to testing the next resistance at 78.99. The increase is also indicated by the MA50 line which has crossed the MA100 line from below. Meanwhile, to change the bias to bearish, the oil price needs to pass the support of 76.76 first to the next support at 75.64.
Suggest : Buy 77.80 TP1 78.30 TP2 78.90 SL 76.76
|
PREVIOUS RANGE |
||||||
|
OPEN |
HIGH |
LOW |
CLOSE |
PREV.CLOSE |
CHANGE |
%CHANGE |
|
75.76 |
77.80 |
75.53 |
76.84 |
75.74 |
1.10 |
1.45% |
|
DAILY PIVOT POINT |
||||||
|
R3 |
R2 |
R1 |
PIVOT |
S1 |
S2 |
S3 |
|
80.18 |
78.99 |
77.91 |
76.72 |
75.64 |
74.45 |
73.37 |
Well, that's the explanation of "Technical Daily Analysis: March 1, 2023 – US Dollar Fluctuates". Also read our other articles, such as an explanation of how to buy cryptocurrencies, only in the GIC Journal. Don't forget to practice your trading skills by getting the Scalping Ebook and following Live Trading on NFP Live Trading. Make sure, download GIC Mobile Apps on the Google Play Store.


