 Last:
Last: 
The following is a technical daily analysis, June 20, 2023. The data and analysis contained in this newsletter can be used on a wide scale for your trading. However, it is important to note that GICTrade and its data providers are not responsible for your trading results. So, it's your own responsibility. Before knowing today's technical analysis, immediately register yourself to take part in the GIC Gebyar Prize and get the main prize, namely Mobile Mitshubshi Expander or Vacation Package to Labuan Bajo for 4 days and 3 nights. In the following, we will inform you about the forecast of price movements in Forex and Commodities which is equipped with the calculation of Pivot points, Resistance and Support levels.
EURUSD
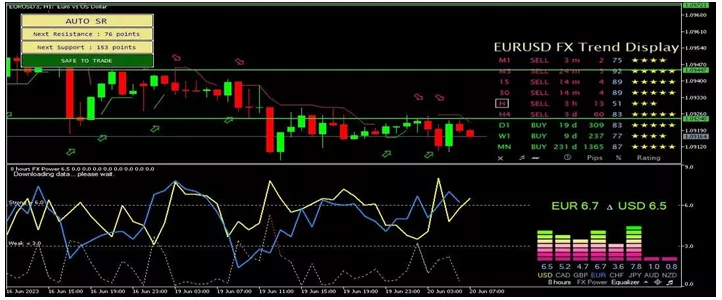
Daily technical analysis for the EUR/USD pair on the 1-hour period tried to move downwards, touching the support level at 1.09100 and heading to the next support level at 1.08710. The downward trend has not yet been seen from the FXBot template, where the EUR figure is slightly higher at 6.7 than the USD figure of 6.5. While the bearish bias is also supported by a sell signal indicated by a red arrow.
Suggest: Sell 1.09100 TP1 1.08890 TP2 1.08710 SL 1.09300
GBPUSD
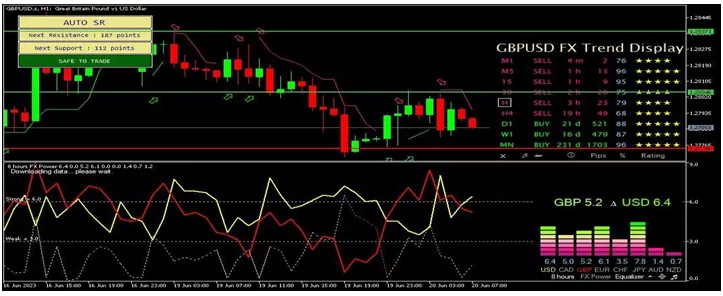
GBP/USD on the 1-hour period tried to move down, touching the support level at 1.27720 until the next support level at 1.27380. The downward trend can also be seen from the FXBot template, where the GBP figure is lower by 5.2 than the USD figure of 6.4. While the bearish bias is also supported by a sell signal indicated by a red arrow.
Suggest: Sell 1.27720 TP1 1.27500 TP2 1.27380 SL 1.28000
AUDUSD
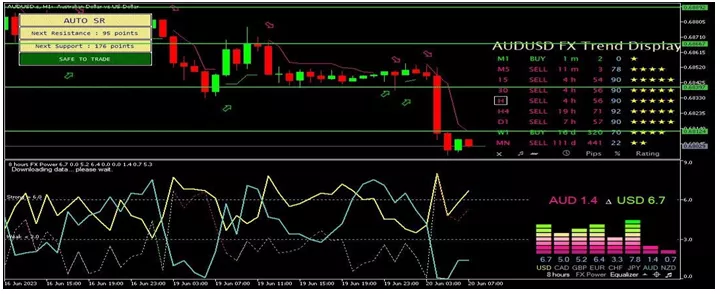
Daily technical analysis for the AUD/USD pair on the 1-hour period tried to move down, touching the support level at 0.67900 to the next support level at 0.67700. The downward trend can also be seen from the FXBot template, where the AUD figure is lower by 1.4 than the USD figure of 6.7. While the bearish bias is also supported by a sell signal indicated by a red arrow.
Suggest: Buy 0.67900 TP1 0.68110 TP2 0.68380 SL 0.67600
USDCHF
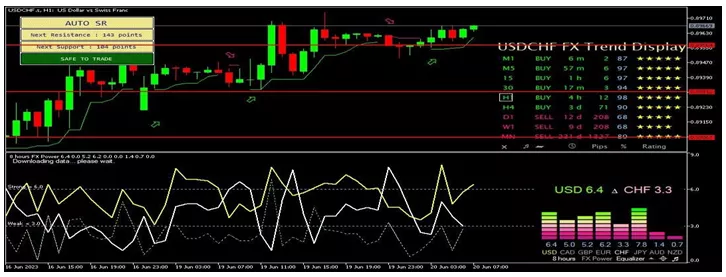
USD/CHF in the 1-hour period moved further up, touching the resistance level at 0.89650 until heading to the next resistance level at 0.90170. The upward trend can also be seen from the FXBot template, where the CHF figure is lower by 3.3 than the USD figure of 6.4. While the bullish bias is also supported by a buy signal indicated by a green arrow.
Suggest: Buy 0.89650 TP1 0.89960 TP2 0.90170 SL 0.89430
USDJPY
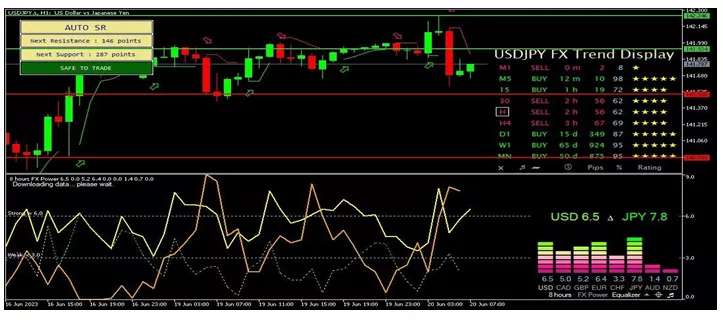
USD/JPY in the 1-hour period tried to move down, touching the support level of 141,550 until heading to the next support level at 141,210. The downward trend can also be seen from the FXBot template, where the JPY figure is higher by 7.8 than the USD figure of 6.5. While the bearish bias is also supported by a sell signal indicated by a red arrow.
Suggest: Sell 141.550 TP1 141.210 TP2 140.990 SL 141.770
XUL (LOCO LONDON GOLD)
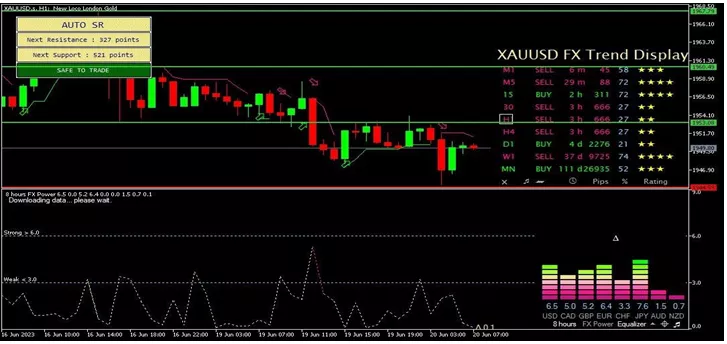
Gold prices in the 1-hour period moved down further, trying to touch the support area at 1941.90 until heading towards the next support level at 1936.20. While the bearish bias is also supported by a sell signal indicated by a red arrow.
Suggest: Sell 1952.80 TP1 1947.10 TP2 1941.90 SL 1957.90
CLSK (OIL)
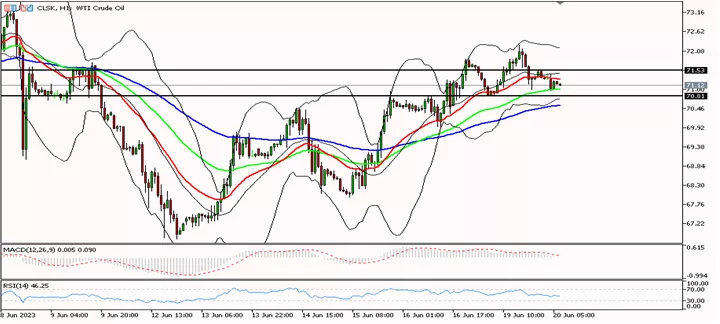
Daily technical analysis for oil prices in the 1-hour period is trying to move down, it needs to pass through the support area at 70.81 to the next support level at 70.08. Meanwhile, to continue the bullish bias, oil prices need to cross the resistance level at 71.53 to reach the next resistance level at 72.21.
Suggest: Sell 70.81 TP1 70.30 TP2 70.00 SL 71.30
So, that's the explanation of "Technical Daily Analysis: June 20, 2023 – Risk-Off Sentiment, US Dollar Soars". Also read our other articles, such as an explanation of how to buy cryptocurrencies, only in the GIC Journal. Don't forget to practice your trading skills by getting the Scalping Ebook and following Live Trading on NFP Live Trading. Make sure, download GIC Mobile Apps on the Google Play Store.


