 Last:
Last: 
The following is a technical daily analysis, January 30, 2023. The data and analysis contained in this newsletter can be used on a wide scale for your trading. However, it is important to note that GICTrade and its data providers are not responsible for your trading results.
So, it's your own responsibility. Before knowing today's technical analysis, immediately register yourself to take part in the GIC Gebyar Prize and get the main prize, namely Mobile Mitshubshi Expander or Vacation Package to Labuan Bajo for 4 days and 3 nights.
In the following, we will inform you about the forecast of price movements in Forex and Commodities which is equipped with the calculation of Pivot points, Resistance and Support levels.
EURUSD
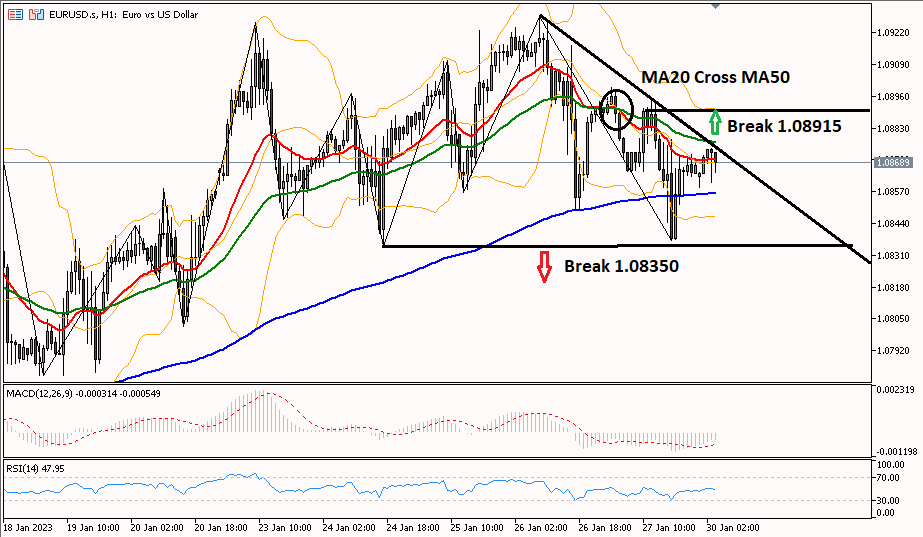
Daily Technical Analysis for the EUR/USD pair on the 1-hour period tends to move downwards, which is confirmed by the MA20 line that has crossed the MA50 line. To continue the downtrend, it is necessary to break the 1.08350 area to test the next support at the level of 1.07860. Meanwhile, if the euro is able to break through the resistance at 1.08915 which is also the upper BB line, then EUR/USD has a chance to rise further until the next resistance at 1.09110.
|
PREVIOUS RANGE |
||||||
|
OPEN |
HIGH |
LOW |
CLOSE |
PREV.CLOSE |
CHANGE |
%CHANGE |
|
1.08906 |
1.08995 |
1.08372 |
1.08678 |
1.08905 |
-0.00227 |
-0.21% |
|
DAILY PIVOT POINT |
||||||
|
R3 |
R2 |
R1 |
PIVOT |
S1 |
S2 |
S3 |
|
1.09730 |
1.09360 |
1.09110 |
1.08740 |
1.08490 |
1.08120 |
1.07860 |
GBPUSD
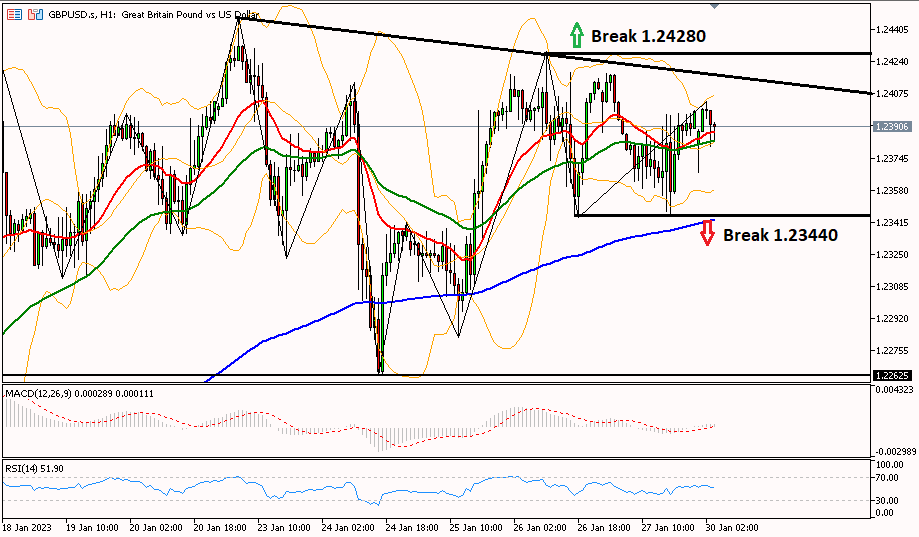
GBP/USD on the 1-hour period moves in the pivot area or the 50 RSI level. It is necessary to break one of the resistance support levels to see the direction of the next trend movement. If the pound is able to break through the support of 1.23440, then the bearish bias continues to the support of 1.22930. However, if GBP/USD is able to break through the resistance of 1.24280, then the bullish bias continues to the resistance of 1.24650.
|
PREVIOUS RANGE |
||||||
|
OPEN |
HIGH |
LOW |
CLOSE |
PREV.CLOSE |
CHANGE |
%CHANGE |
|
1.24083 |
1.24179 |
1.23447 |
1.23985 |
1.24104 |
-0.00119 |
-0.10% |
|
DAILY PIVOT POINT |
||||||
|
R3 |
R2 |
R1 |
PIVOT |
S1 |
S2 |
S3 |
|
1.25130 |
1.24650 |
1.24390 |
1.23920 |
1.23660 |
1.23190 |
1.22930 |
AUDUSD
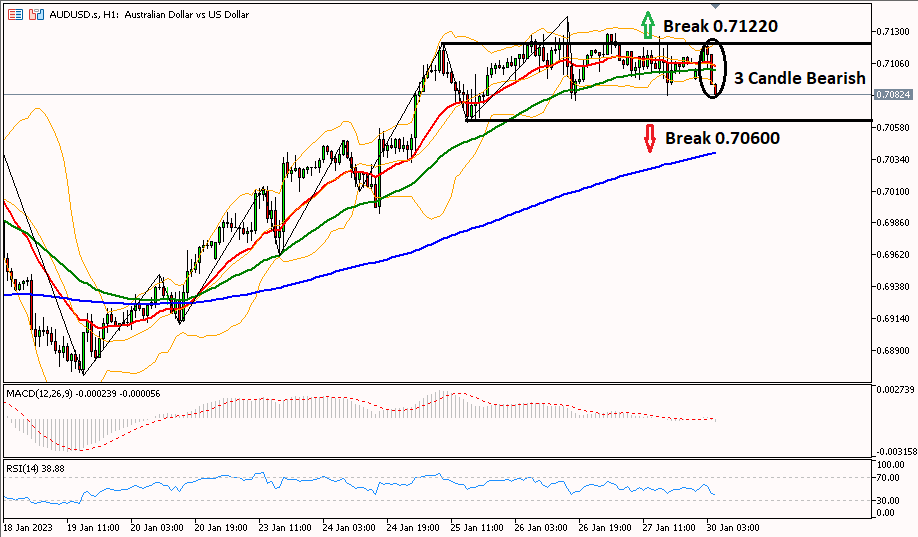
Daily Technical Analysis for the AUD/USD pair has the potential to decline which is indicated by a bearish 3-candle pattern which means that the decline will continue. It needs to break the support at 0.70600 to fall further. Meanwhile, to turn the bias into bullish, the aussie needs to break through the resistance at 0.71220 to test the next resistance at 0.71550.
|
PREVIOUS RANGE |
||||||
|
OPEN |
HIGH |
LOW |
CLOSE |
PREV.CLOSE |
CHANGE |
%CHANGE |
|
0.71139 |
0.71287 |
0.70815 |
0.71063 |
0.71139 |
-0.00076 |
-0.11% |
|
DAILY PIVOT POINT |
||||||
|
R3 |
R2 |
R1 |
PIVOT |
S1 |
S2 |
S3 |
|
0.71820 |
0.71550 |
0.71350 |
0.71080 |
0.70870 |
0.70610 |
0.70400 |
USDCHF
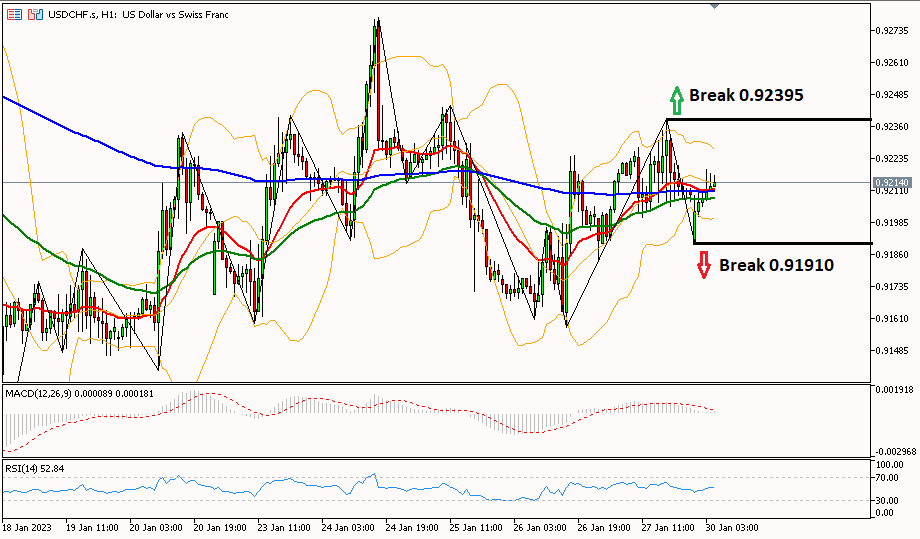
The USD/CHF pair in the 1-hour period moves in the pivot area or the 50 RSI level. It is necessary to break one of the resistance support levels to see the direction of the next trend movement. If the franc is able to break through the 0.91910 support, then the bearish bias continues to the 0.91530 support. However, if USD/CHF is able to break through the resistance of 0.92395, then the bullish bias continues to the resistance of 0.92870.
|
PREVIOUS RANGE |
||||||
|
OPEN |
HIGH |
LOW |
CLOSE |
PREV.CLOSE |
CHANGE |
%CHANGE |
|
0.92000 |
0.92389 |
0.91839 |
0.92094 |
0.92016 |
0.00078 |
0.09% |
|
DAILY PIVOT POINT |
||||||
|
R3 |
R2 |
R1 |
PIVOT |
S1 |
S2 |
S3 |
|
0.92870 |
0.92630 |
0.92320 |
0.92080 |
0.91770 |
0.91530 |
0.91220 |
USDJPY
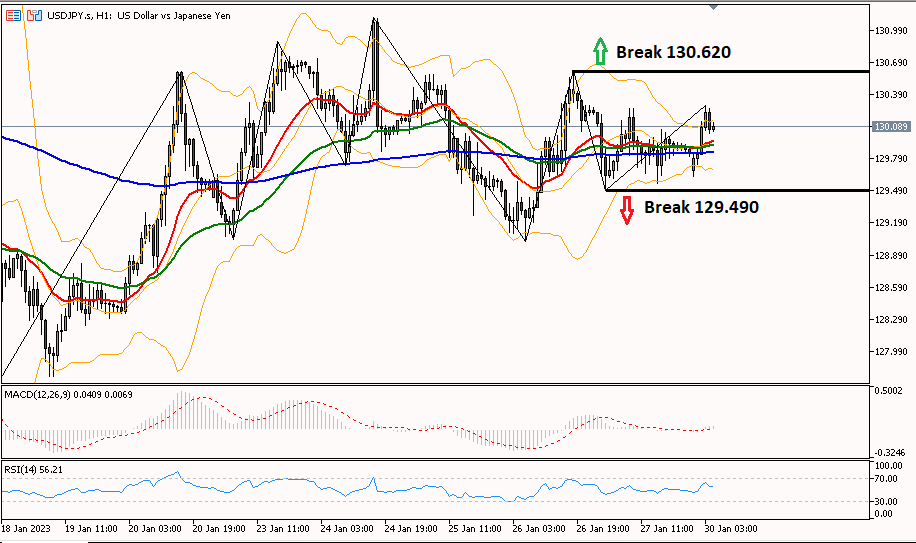
It is necessary to break one of the resistance support levels to see the next movement of USD/JPY. If the yen is able to break through the resistance of 130,620, then the bullish bias continues until the next resistance at 131,190. However, if USD/JPY breaks the support of 129.490, then the bearish bias continues until the next support at 128.890.
|
PREVIOUS RANGE |
||||||
|
OPEN |
HIGH |
LOW |
CLOSE |
PREV.CLOSE |
CHANGE |
%CHANGE |
|
130.218 |
130.262 |
129.494 |
129.846 |
130.218 |
-0.372 |
-0.28% |
|
DAILY PIVOT POINT |
||||||
|
R3 |
R2 |
R1 |
PIVOT |
S1 |
S2 |
S3 |
|
131.190 |
130.730 |
130.430 |
129.960 |
129.660 |
129.190 |
128.890 |
XUL (LOCO LONDON GOLD)
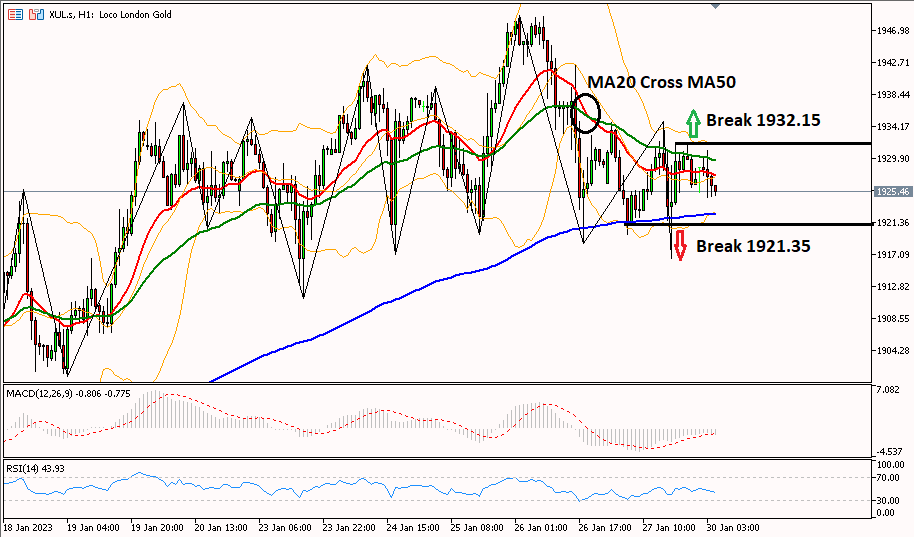
Gold prices are likely to decline further which is confirmed by the MA20 line which has crossed the MA50 line in the 1-hour period. A further decline occurs, if the gold price is able to pass the 1921.35 area which is also the lower BB line to the next support at 1908.00. However, if gold breaks the resistance of 1932.15, then the bullish bias continues until the resistance of 1944.60.
|
PREVIOUS RANGE |
||||||
|
OPEN |
HIGH |
LOW |
CLOSE |
PREV.CLOSE |
CHANGE |
%CHANGE |
|
1926.49 |
1934.86 |
1916.60 |
1927.13 |
1929.14 |
-2.01 |
-0.10% |
|
DAILY PIVOT POINT |
||||||
|
R3 |
R2 |
R1 |
PIVOT |
S1 |
S2 |
S3 |
|
1954.30 |
1944.60 |
1936.00 |
1926.30 |
1917.70 |
1908.00 |
1899.50 |
CLSK (OIL)
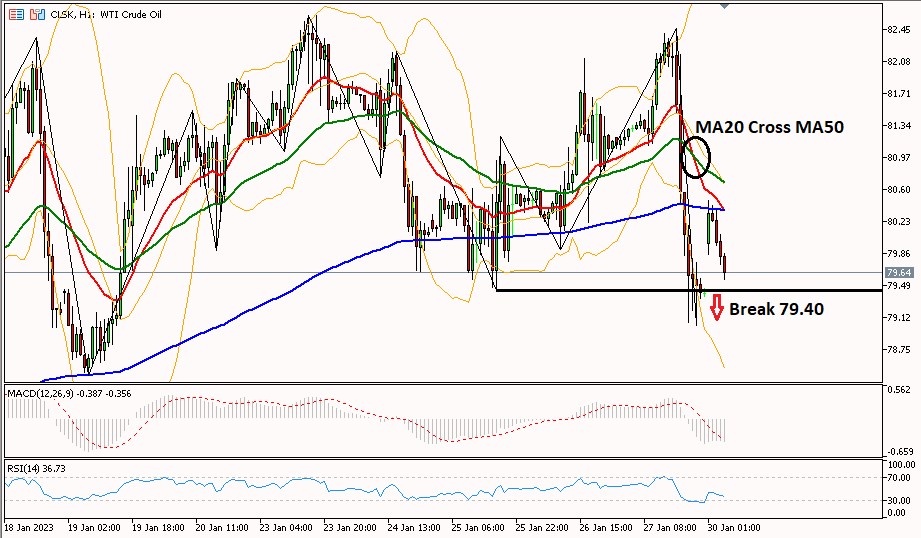
Technical Daily Analysis for oil prices is likely to move down after the MA20 line crosses the MA50 line from above, indicating a decline. A break of the 79.40 level is needed for oil to fall further to the next support level at 78.14.
|
PREVIOUS RANGE |
||||||
|
OPEN |
HIGH |
LOW |
CLOSE |
PREV.CLOSE |
CHANGE |
%CHANGE |
|
81.20 |
82.46 |
79.03 |
79.40 |
81.15 |
-1.75 |
-2.16% |
|
DAILY PIVOT POINT |
||||||
|
R3 |
R2 |
R1 |
PIVOT |
S1 |
S2 |
S3 |
|
85.00 |
83.73 |
81.57 |
80.30 |
78.14 |
76.87 |
74.71 |
Well, that's the explanation of "Technical Daily Analysis: January 30, 2023 – US Dollar Sideways,". Also read our other articles, such as an explanation of how to buy cryptocurrencies, only in the GIC Journal. Don't forget to practice your trading skills by getting the Scalping Ebook and following Live Trading on NFP Live Trading. Make sure, download GIC Mobile Apps on the Google Play Store.


