Last:
Last: 
The following is a technical daily analysis, January 26, 2023. The data and analysis contained in this newsletter can be used on a wide scale for your trading. However, it is important to note that GICTrade and its data providers are not responsible for your trading results.
So, it's your own responsibility. Before knowing today's technical analysis, immediately register yourself to take part in the GIC Gebyar Prize and get the main prize, namely Mobile Mitshubshi Expander or Vacation Package to Labuan Bajo for 4 days and 3 nights.
In the following, we will inform you about the forecast of price movements in Forex and Commodities which is equipped with the calculation of Pivot points, Resistance and Support levels.
EURUSD
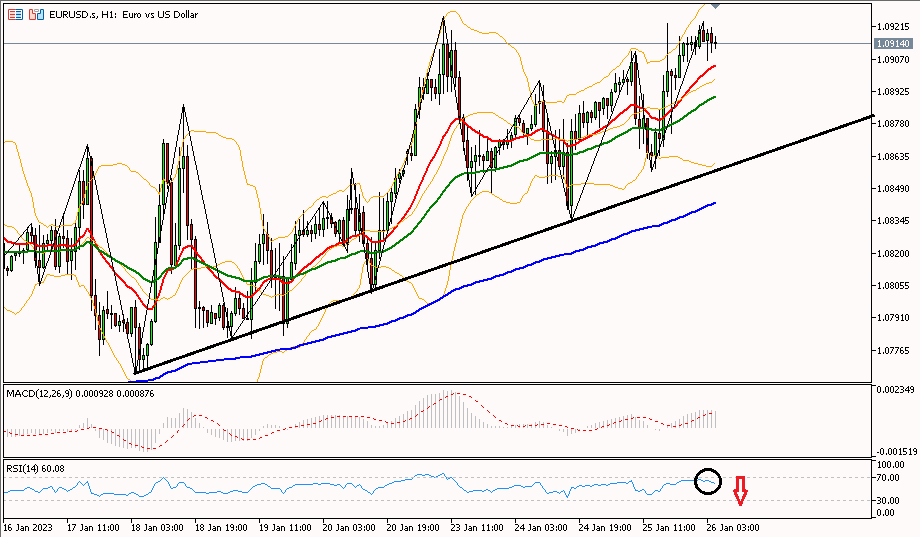
Daily Technical Analysis for the EUR/USD pair is trying to move further upwards, testing the resistance level at 1.09340 to towards R2 at 1.09620. This increase is supported by a trend line with high low prices (Lower High/LH). However, the RSI is already in the overbought area, so EUR/USD has the potential to correct. To turn the bias bearish, it is necessary to first pass through the pivot area at 1.08950 towards the support of 1.08670.
|
PREVIOUS RANGE |
||||||
|
OPEN |
HIGH |
LOW |
CLOSE |
PREV.CLOSE |
CHANGE |
%CHANGE |
|
1.08876 |
1.09230 |
1.08565 |
1.09144 |
1.08876 |
0.00268 |
0.25% |
|
DAILY PIVOT POINT |
||||||
|
R3 |
R2 |
R1 |
PIVOT |
S1 |
S2 |
S3 |
|
1.10000 |
1.09620 |
1.09340 |
1.08950 |
1.08670 |
1.08290 |
1.08000 |
GBPUSD
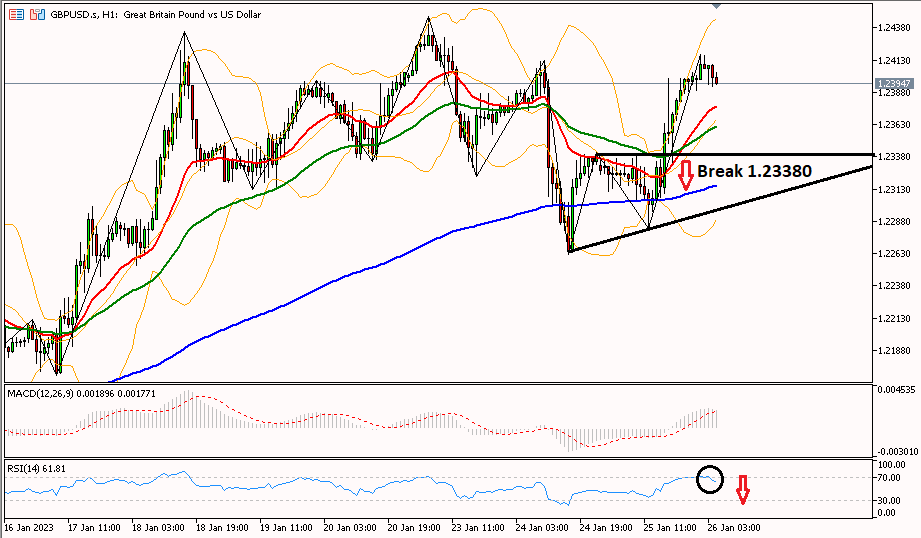
GBP/USD moved up after the MA20 line crossed the MA50 line in the 1-hour period. To continue the bulls, it is necessary to break the resistance area at 1.24260 first to head towards R2 at 1.24750. However, the RSI is already in the overbought area, so GBP/USD has a chance to fall. To change the bias to bearish, it is necessary to break the area of 1.23380 to support 1.23050.
|
PREVIOUS RANGE |
||||||
|
OPEN |
HIGH |
LOW |
CLOSE |
PREV.CLOSE |
CHANGE |
%CHANGE |
|
1.23315 |
1.24032 |
1.22824 |
1.24001 |
1.23380 |
0.00621 |
0.50% |
|
DAILY PIVOT POINT |
||||||
|
R3 |
R2 |
R1 |
PIVOT |
S1 |
S2 |
S3 |
|
1.25460 |
1.24750 |
1.24260 |
1.23540 |
1.23050 |
1.22330 |
1.21840 |
AUDUSD
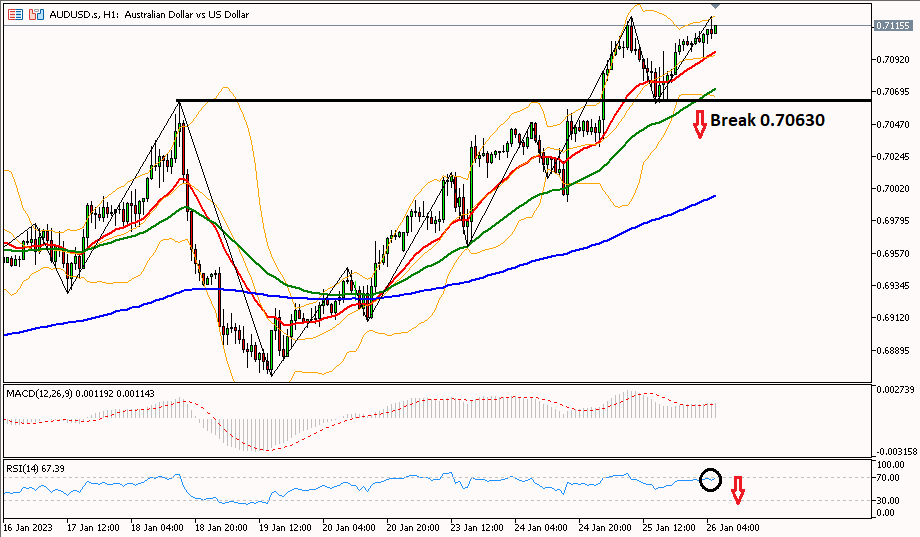
AUD/USD is trying to move further up, testing the resistance level at 0.71650 to towards R3 at 0.72090. This increase is supported by a trend line with high low prices (Lower High/LH). However, the RSI is already in the overbought area, so AUD/USD has the potential to correct. To turn the bias bearish, it is necessary to first cross the pivot area at 0.70750 towards the 0.70280 support.
|
PREVIOUS RANGE |
||||||
|
OPEN |
HIGH |
LOW |
CLOSE |
PREV.CLOSE |
CHANGE |
%CHANGE |
|
0.70444 |
0.71217 |
0.70313 |
0.71025 |
0.70444 |
0.00581 |
0.82% |
|
DAILY PIVOT POINT |
||||||
|
R3 |
R2 |
R1 |
PIVOT |
S1 |
S2 |
S3 |
|
0.72090 |
0.71650 |
0.71190 |
0.70750 |
0.70280 |
0.69850 |
0.69380 |
USDCHF
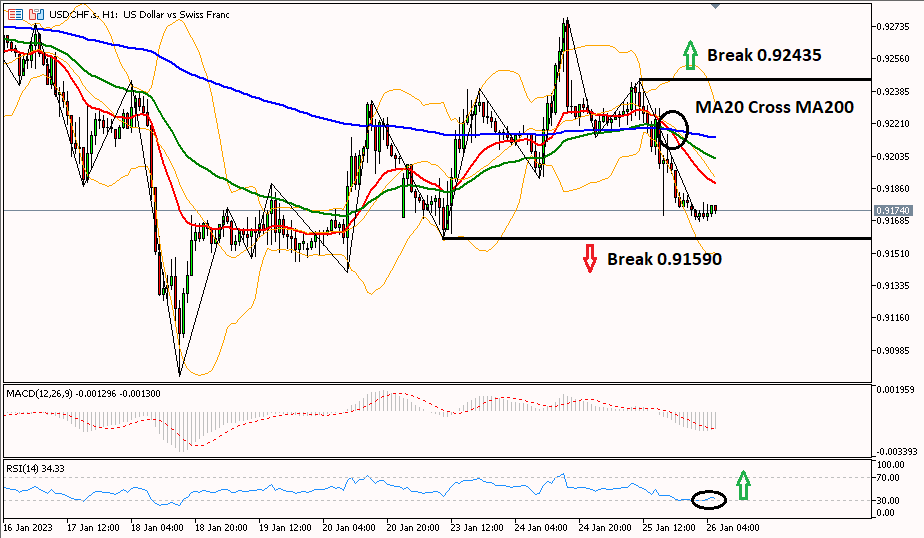
Daily Technical Analysis for the USD/CHF pair is still in a downtrend, with the MA20 line crossing the MA50 line on the 1-hour period indicating further decline. A break of the 0.91590 level is needed for the franc to fall further to the 0.91310 support. However, the RSI is in the oversold area, so USD/CHF has the potential to rebound, needing a break of 0.92435 to change the bias to bullish to resistance 0.92770.
|
PREVIOUS RANGE |
||||||
|
OPEN |
HIGH |
LOW |
CLOSE |
PREV.CLOSE |
CHANGE |
%CHANGE |
|
0.92226 |
0.92442 |
0.91715 |
0.91781 |
0.92225 |
-0.00444 |
-0.48% |
|
DAILY PIVOT POINT |
||||||
|
R3 |
R2 |
R1 |
PIVOT |
S1 |
S2 |
S3 |
|
0.93090 |
0.92770 |
0.92370 |
0.92040 |
0.91640 |
0.91310 |
0.90910 |
USDJPY
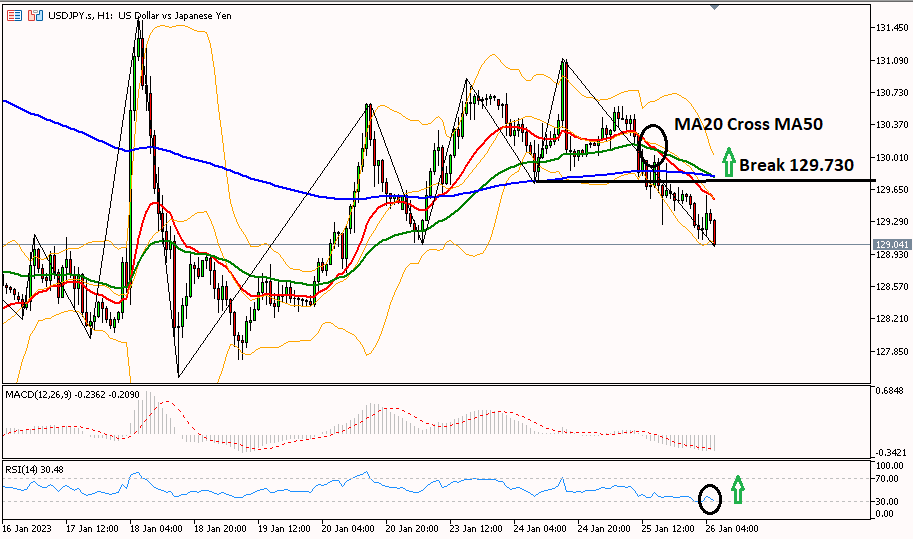
USD/JPY is still in a downtrend, with the MA20 line crossing the MA50 line on the 1-hour period indicating further decline. A break of the second support level at 128,580 is needed for the yen to fall further to the strongest support at 127,890. However, the RSI is in the oversold area, so USD/JPY has the potential to rebound, needing a break of 129,730 to change the bias to bullish to resistance 130,520.
|
PREVIOUS RANGE |
||||||
|
OPEN |
HIGH |
LOW |
CLOSE |
PREV.CLOSE |
CHANGE |
%CHANGE |
|
130.162 |
130.577 |
129.262 |
129.575 |
130.162 |
-0.587 |
-0.45% |
|
DAILY PIVOT POINT |
||||||
|
R3 |
R2 |
R1 |
PIVOT |
S1 |
S2 |
S3 |
|
131.830 |
131.210 |
130.520 |
129.890 |
129.200 |
128.580 |
127.890 |
XUL (LOCO LONDON GOLD)
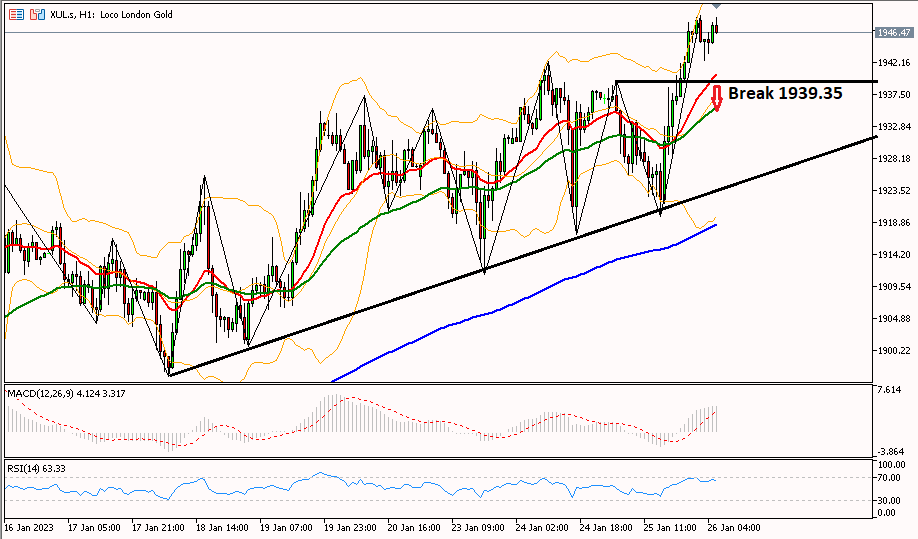
Gold prices have the opportunity to rise further to test the resistance level of 1955.70 to R2 at 1965.90. This increase is supported by a trend line with high low prices (Lower High/LH). However, the RSI is already in the overbought area, so the price of gold can be corrected. To turn the bias bearish, it is necessary to cross the 1939.35 area first towards the 1927.50 support again.
|
PREVIOUS RANGE |
||||||
|
OPEN |
HIGH |
LOW |
CLOSE |
PREV.CLOSE |
CHANGE |
%CHANGE |
|
1936.85 |
1947.89 |
1919.71 |
1946.18 |
1937.05 |
9.13 |
0.47% |
|
DAILY PIVOT POINT |
||||||
|
R3 |
R2 |
R1 |
PIVOT |
S1 |
S2 |
S3 |
|
1983.90 |
1965.90 |
1955.70 |
1937.70 |
1927.50 |
1909.50 |
1899.30 |
CLSK (OIL)
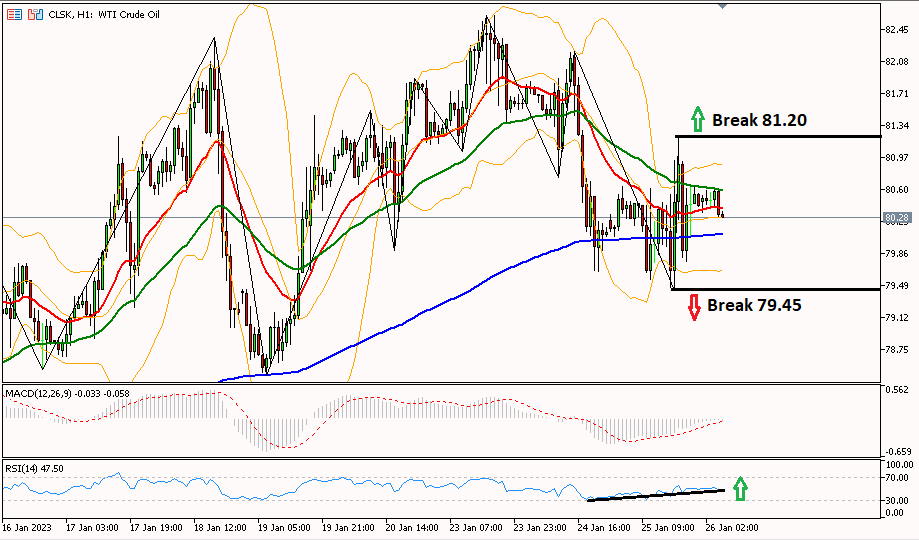
Daily Technical Analysis for Oil needs to break one of the resistance support levels to see the next trend of oil movement. If the oil price is able to break through the resistance area of 81.20, then the bulls will continue until 82.13. However, if the oil price is able to break through the support area at 79.45, then the bears continue to the support at 78.57.
|
PREVIOUS RANGE |
||||||
|
OPEN |
HIGH |
LOW |
CLOSE |
PREV.CLOSE |
CHANGE |
%CHANGE |
|
80.24 |
81.21 |
79.43 |
80.41 |
80.10 |
0.31 |
0.39% |
|
DAILY PIVOT POINT |
||||||
|
R3 |
R2 |
R1 |
PIVOT |
S1 |
S2 |
S3 |
|
83.05 |
82.13 |
81.27 |
80.35 |
79.49 |
78.57 |
77.71 |
So, that's the explanation of "Technical Daily Analysis: January 26, 2023 – Greenback Under Pressure,". Also read our other articles, such as an explanation of how to buy cryptocurrencies, only in the GIC Journal. Don't forget to practice your trading skills by getting the Scalping Ebook and following Live Trading on NFP Live Trading. Make sure, download GIC Mobile Apps on the Google Play Store.