 Last:
Last: 
The following is a technical daily analysis, January 25, 2023. The data and analysis contained in this newsletter can be used on a wide scale for your trading. However, it is important to note that GICTrade and its data providers are not responsible for your trading results.
So, it's your own responsibility. Before knowing today's technical analysis, immediately register yourself to take part in the GIC Gebyar Prize and get the main prize, namely Mobile Mitshubshi Expander or Vacation Package to Labuan Bajo for 4 days and 3 nights.
In the following, we will inform you about the forecast of price movements in Forex and Commodities which is equipped with the calculation of Pivot points, Resistance and Support levels.
EURUSD
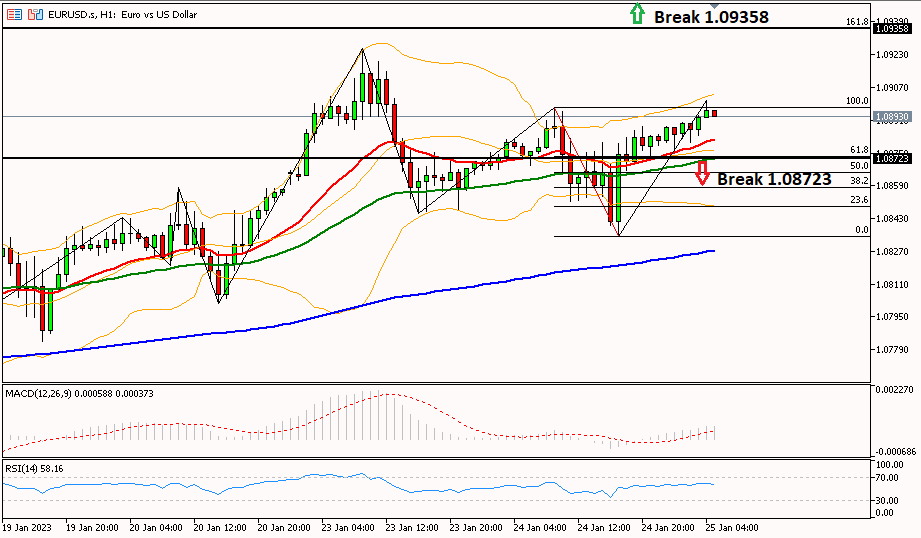
EUR/USD is trying to move further upwards, testing the resistance level of two (R2) at 1.09360 which is also the 161.8 Fibonacci level in the 1-hour period. However, if the price is able to break through the pivot area at 1.08730 which is also the 61.8 Fibonacci level, then the bias will change to bearish towards the 1.08490 support.
|
PREVIOUS RANGE |
||||||
|
OPEN |
HIGH |
LOW |
CLOSE |
PREV.CLOSE |
CHANGE |
%CHANGE |
|
1.08706 |
1.08973 |
1.08345 |
1.08876 |
1.08707 |
0.00169 |
0.16% |
|
DAILY PIVOT POINT |
||||||
|
R3 |
R2 |
R1 |
PIVOT |
S1 |
S2 |
S3 |
|
1.09740 |
1.09360 |
1.09120 |
1.08730 |
1.08490 |
1.08100 |
1.07860 |
GBPUSD
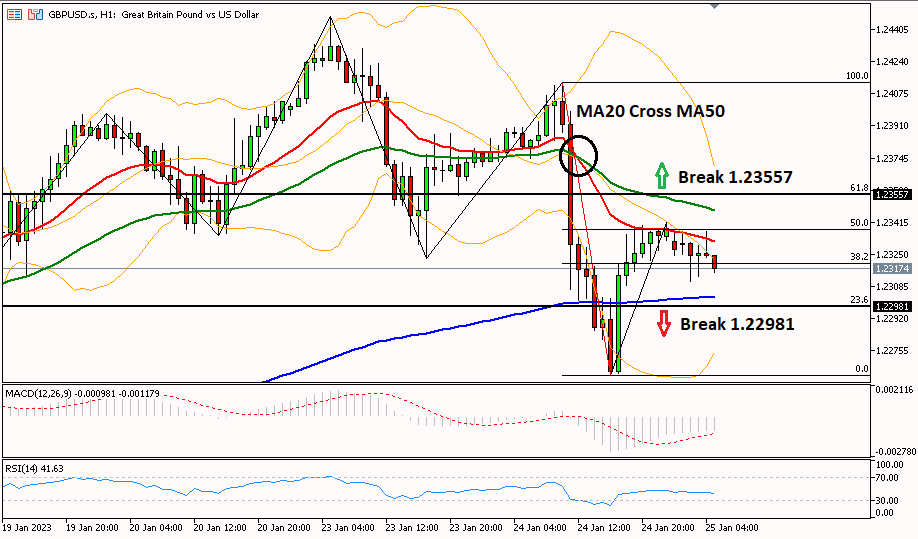
Daily Technical Analysis for the GBP/USD pair is observed moving downwards, with the MA20 line crossing the MA50 line from above indicating a decline in the 1-hour period. To continue the downtrend, it is necessary to break the 1.22981 area which is the 23.6 Fibonacci level. However, the bias will be bullish if the price is able to break through the 1.23557 area which is the 61.8 Fibonacci level, towards the resistance of 1.24330.
|
PREVIOUS RANGE |
||||||
|
OPEN |
HIGH |
LOW |
CLOSE |
PREV.CLOSE |
CHANGE |
%CHANGE |
|
1.23769 |
1.24131 |
1.22625 |
1.23380 |
1.23777 |
-0.00397 |
-0.32% |
|
DAILY PIVOT POINT |
||||||
|
R3 |
R2 |
R1 |
PIVOT |
S1 |
S2 |
S3 |
|
1.25840 |
1.24990 |
1.24330 |
1.23480 |
1.22830 |
1.21970 |
1.21320 |
AUDUSD
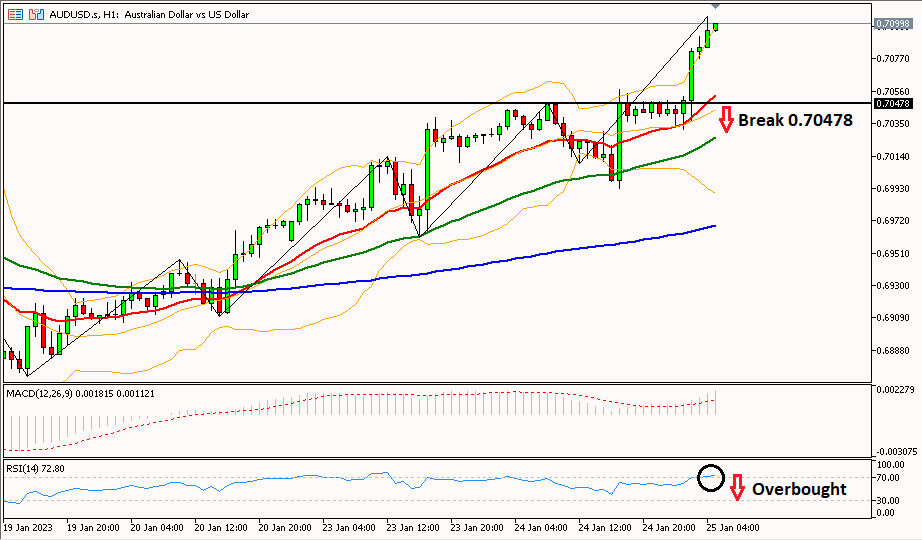
AUD/USD is in a bullish trend supported by the MA50 line crossing the MA200 line from below, towards the advanced resistance (R3) which is at 0.71310. However, referring to the RSI indicator in the 1-hour period which is already in the overbought area, the aussie has the potential to correct, if it is able to break through the 0.70478 area again and towards the 0.70030 support.
|
PREVIOUS RANGE |
||||||
|
OPEN |
HIGH |
LOW |
CLOSE |
PREV.CLOSE |
CHANGE |
%CHANGE |
|
0.70273 |
0.70570 |
0.69928 |
0.70444 |
0.70276 |
0.00168 |
0.24% |
|
DAILY PIVOT POINT |
||||||
|
R3 |
R2 |
R1 |
PIVOT |
S1 |
S2 |
S3 |
|
0.71310 |
0.70940 |
0.70670 |
0.70300 |
0.70030 |
0.69660 |
0.69390 |
USDCHF
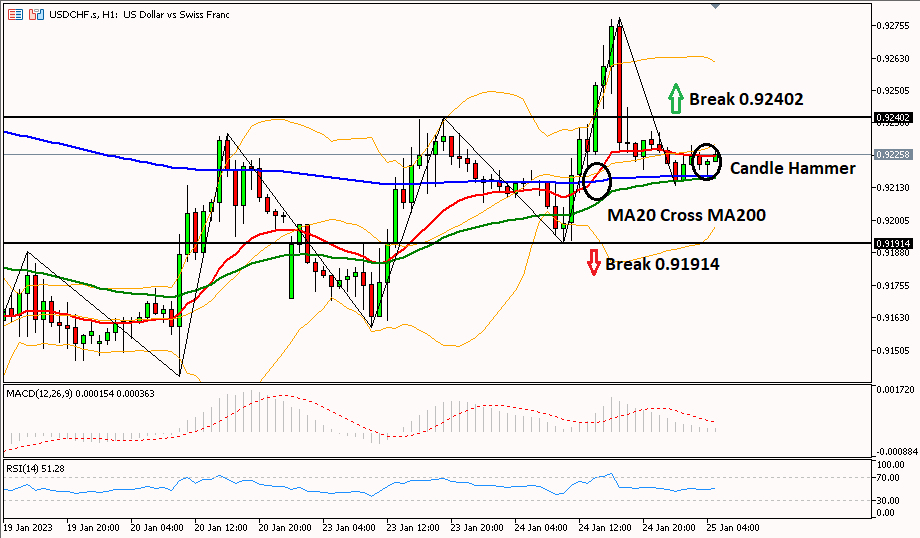
The USD/CHF pair in the 1-hour period tends to move up, testing the resistance of 0.92402 to R2 at 0.93140. The rise of the Swiss franc is also supported by the Hammer candle pattern and also the MA20 line which crosses the MA200 line from below. Meanwhile, to change the bias to bearish, it is necessary to break the support of 0.91914 first to the next support at 0.91400.
|
PREVIOUS RANGE |
||||||
|
OPEN |
HIGH |
LOW |
CLOSE |
PREV.CLOSE |
CHANGE |
%CHANGE |
|
0.92162 |
0.92786 |
0.91914 |
0.92225 |
0.92166 |
0.00059 |
0.07% |
|
DAILY PIVOT POINT |
||||||
|
R3 |
R2 |
R1 |
PIVOT |
S1 |
S2 |
S3 |
|
0.93500 |
0.93140 |
0.92630 |
0.92270 |
0.91750 |
0.91400 |
0.90880 |
USDJPY
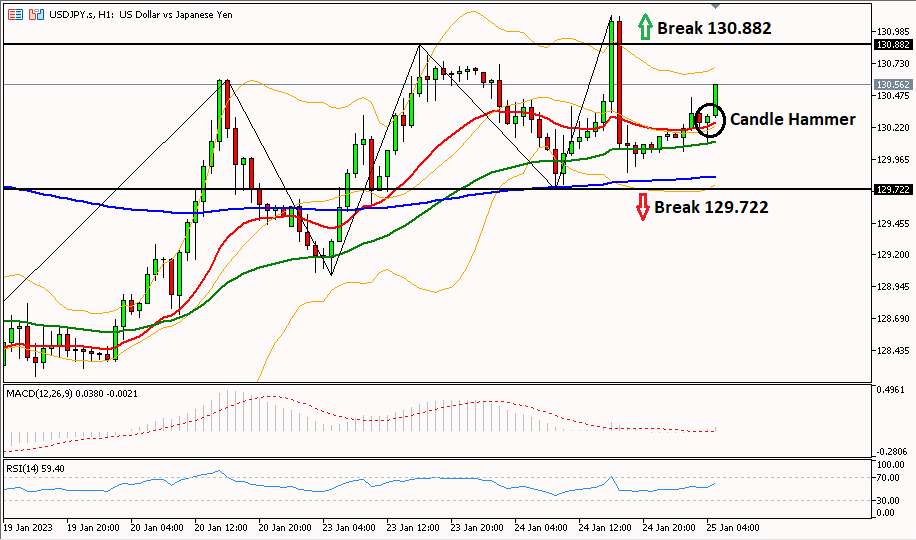
Daily Technical Analysis for the USD/JPY pair has a chance to rise further, as seen from the MA50 line which has crossed the MA200 line in the 1-hour period. It needs to break the 130,882 area to rise further until the next resistance at 131,800. The rise of the Japanese yen is also supported by the Hammer candle pattern. Meanwhile, if the USD/JPY pair is able to break through the support of 129,722 again, then the decline continues to the support of 129,020.
|
PREVIOUS RANGE |
||||||
|
OPEN |
HIGH |
LOW |
CLOSE |
PREV.CLOSE |
CHANGE |
%CHANGE |
|
130.655 |
131.111 |
129.722 |
130.162 |
130.673 |
-0.511 |
-0.39% |
|
DAILY PIVOT POINT |
||||||
|
R3 |
R2 |
R1 |
PIVOT |
S1 |
S2 |
S3 |
|
132.490 |
131.800 |
131.100 |
130.410 |
129.710 |
129.020 |
128.320 |
XUL (LOCO LONDON GOLD)
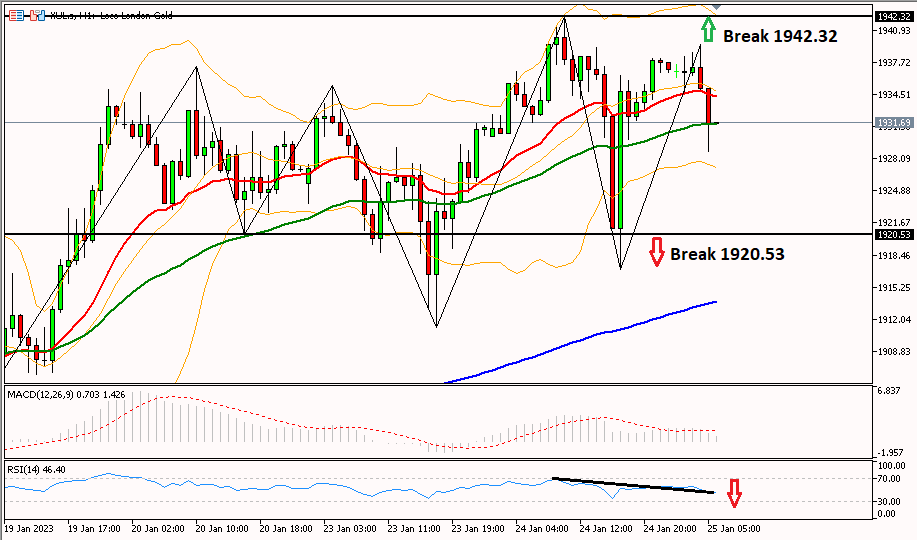
Daily Technical Analysis for gold prices is observed to be corrected to test the 1920.53 support level towards the next support at 1906.40. Gold's decline was also supported by the RSI indicator which moved down towards the 30 RSI level. However, if the price is able to break through the resistance of 1942.32, then the bullish bias continues until the next resistance at 1957.00.
|
PREVIOUS RANGE |
||||||
|
OPEN |
HIGH |
LOW |
CLOSE |
PREV.CLOSE |
CHANGE |
%CHANGE |
|
1930.36 |
1942.32 |
1917.04 |
1937.05 |
1931.26 |
5.79 |
0.30% |
|
DAILY PIVOT POINT |
||||||
|
R3 |
R2 |
R1 |
PIVOT |
S1 |
S2 |
S3 |
|
1971.60 |
1957.00 |
1946.40 |
1931.70 |
1921.10 |
1906.40 |
1895.80 |
CLSK (OIL)
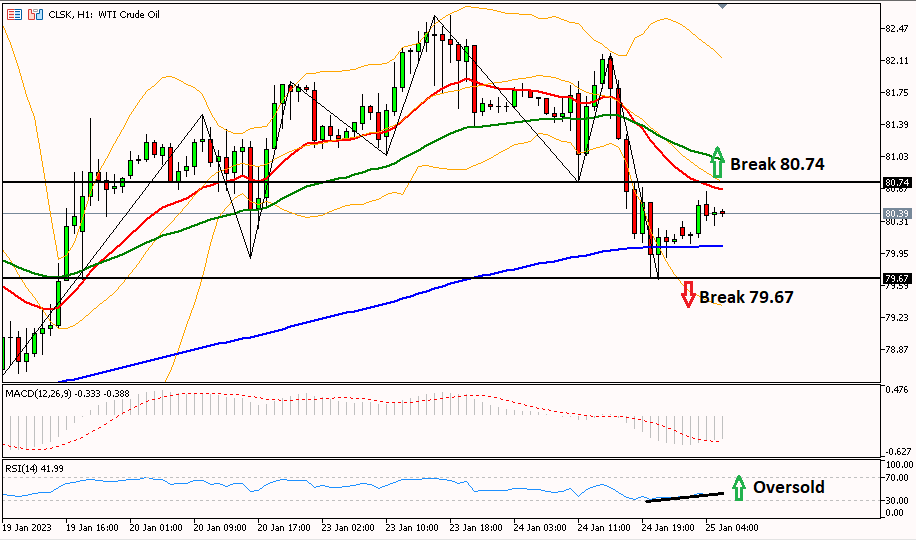
A break of the resistance level at 80.74 is needed for oil to turn the bias into a bullish one, with the next resistance target at 81.65. The increase in oil prices is also supported by the 1-hour period RSI indicator which has been in the oversold area. However, if maple oil breaks through the 79.67 support level then the decline continues to the 78.11 support.
|
PREVIOUS RANGE |
||||||
|
OPEN |
HIGH |
LOW |
CLOSE |
PREV.CLOSE |
CHANGE |
%CHANGE |
|
81.60 |
82.19 |
79.65 |
80.10 |
81.59 |
-1.49 |
-1.83% |
|
DAILY PIVOT POINT |
||||||
|
R3 |
R2 |
R1 |
PIVOT |
S1 |
S2 |
S3 |
|
84.19 |
83.19 |
81.65 |
80.65 |
79.11 |
78.11 |
76.57 |
So, that's the explanation of "Technical Daily Analysis: January 25, 2023 – US Dollar Moves Rebound,". Also read our other articles, such as an explanation of how to buy cryptocurrencies, only in the GIC Journal. Don't forget to practice your trading skills by getting the Scalping Ebook and following Live Trading on NFP Live Trading. Make sure, download GIC Mobile Apps on the Google Play Store.


