 Last:
Last: 
The following is a daily technical analysis, January 20, 2023. The data and analysis contained in this newsletter can be used on a wide scale for your trading. However, it is important to note that GICTrade and its data providers are not responsible for your trading results.
So, it's your own responsibility. Before knowing today's technical analysis, immediately register yourself to take part in the GIC Gebyar Prize and get the main prize, namely Mobile Mitshubshi Expander or Vacation Package to Labuan Bajo for 4 days and 3 nights.
In the following, we will inform you about the forecast of price movements in Forex and Commodities which is equipped with the calculation of Pivot points, Resistance and Support levels.
EURUSD
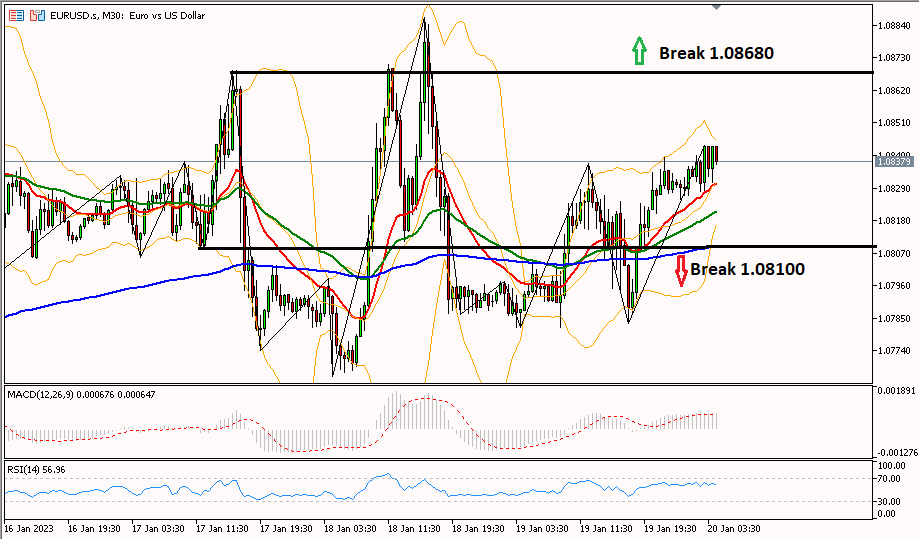
Daily technical analysis for EUR/USD tends to move sideways or flat, it needs to break one of the resistance support levels to determine the next trend. It needs to break the resistance at 1.08680 to continue the rise until the next resistance level at 1.08980. However, if it manages to break through the support area at 1.08100 then the euro has the potential to fall further to the 1.07540 support.
|
PREVIOUS RANGE |
||||||
|
OPEN |
HIGH |
LOW |
CLOSE |
PREV.CLOSE |
CHANGE |
%CHANGE |
|
1.07929 |
1.08392 |
1.07818 |
1.08302 |
1.07934 |
0.00368 |
0.34% |
|
DAILY PIVOT POINT |
||||||
|
R3 |
R2 |
R1 |
PIVOT |
S1 |
S2 |
S3 |
|
1.08980 |
1.08680 |
1.08400 |
1.08110 |
1.07830 |
1.07540 |
1.07250 |
GBPUSD
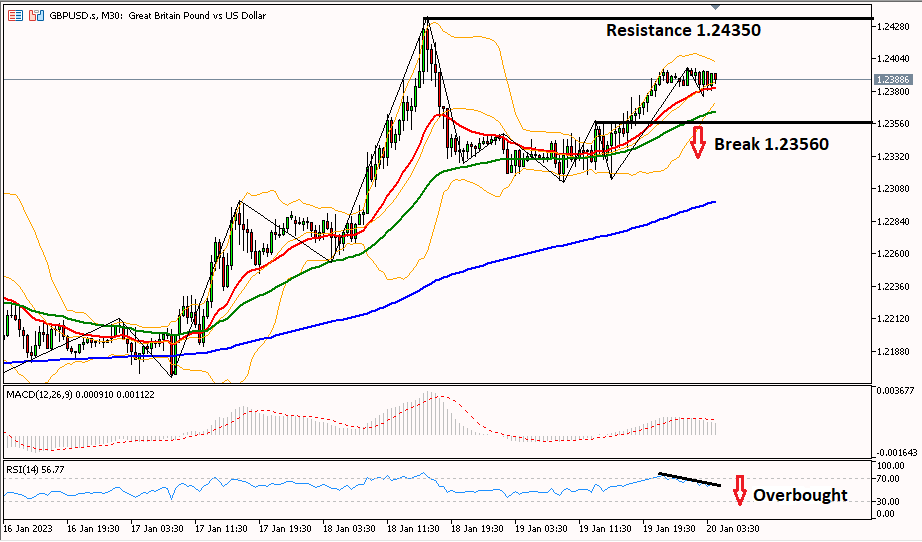
GBP/USD tends to move down or correct, as seen from the RSI indicator in the 30-minute period which is already in the overbought area and moving down towards the 30 RSI area. It needs a break of the 1.23560 area to change the bias to bearish until the next support at 1.22770.
|
PREVIOUS RANGE |
||||||
|
OPEN |
HIGH |
LOW |
CLOSE |
PREV.CLOSE |
CHANGE |
%CHANGE |
|
1.23425 |
1.23967 |
1.23124 |
1.23904 |
1.23431 |
0.00473 |
0.38% |
|
DAILY PIVOT POINT |
||||||
|
R3 |
R2 |
R1 |
PIVOT |
S1 |
S2 |
S3 |
|
1.24940 |
1.24450 |
1.24100 |
1.23610 |
1.23250 |
1.22770 |
1.22410 |
AUDUSD
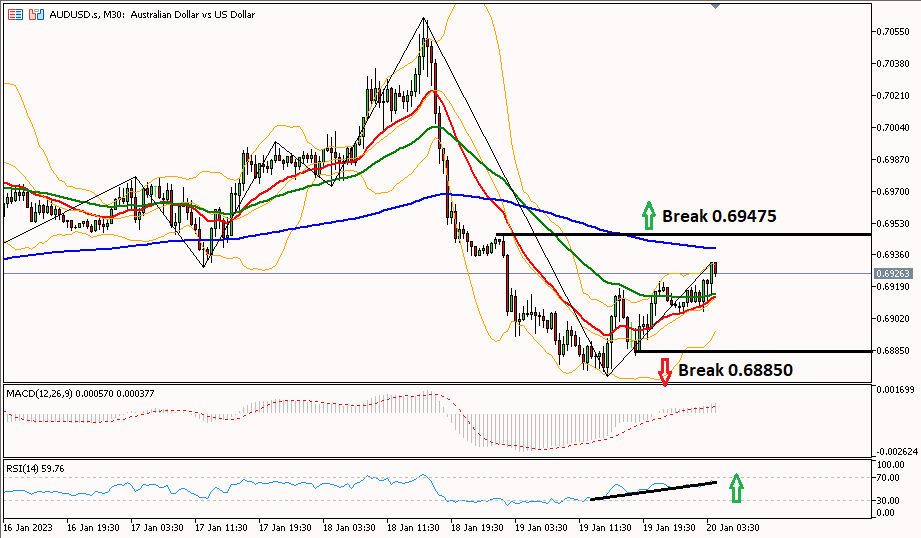
AUD/USD has a chance to rebound, if it is able to break through the resistance area at 0.69475 towards the next resistance at 0.69930. The aussie rebound also occurred amid the RSI indicator moving towards the 70 RSI area in the 30-minute period. However, the aussie decline will continue if the price moves past the 0.68850 support area towards the next support at 0.68410.
|
PREVIOUS RANGE |
||||||
|
OPEN |
HIGH |
LOW |
CLOSE |
PREV.CLOSE |
CHANGE |
%CHANGE |
|
0.69406 |
0.69472 |
0.68712 |
0.69089 |
0.69396 |
-0.00307 |
-0.45% |
|
DAILY PIVOT POINT |
||||||
|
R3 |
R2 |
R1 |
PIVOT |
S1 |
S2 |
S3 |
|
0.70390 |
0.69930 |
0.69630 |
0.69170 |
0.68870 |
0.68410 |
0.68110 |
USDCHF
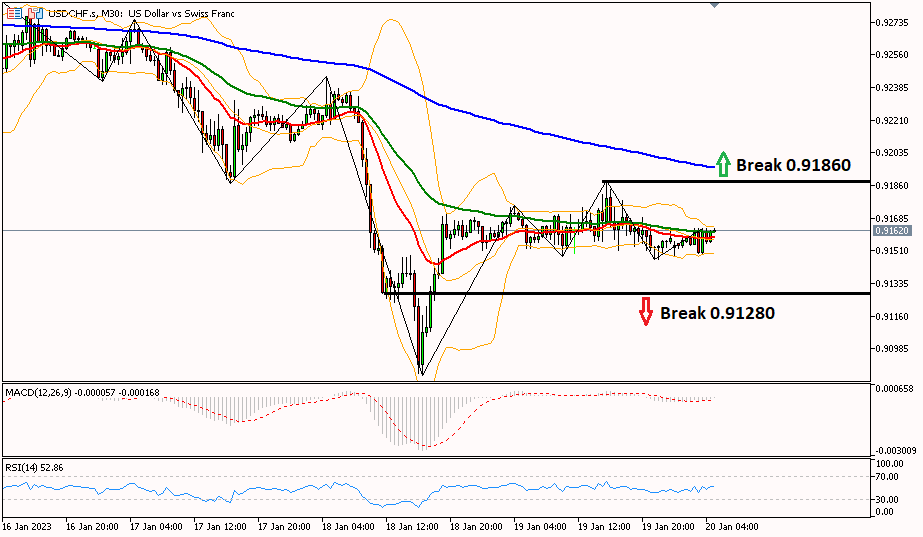
The USD/CHF pair in the 30-minute period moves sideways or flat, needing to break one of the nearest resistance and support levels. A break of the 0.91280 area is needed to continue the bearish trend until the next support level in the 0.90980 region. However, the bias will turn bullish if the Swiss franc is able to break through the resistance area at 0.91860 to test the resistance at 0.92230.
|
PREVIOUS RANGE |
||||||
|
OPEN |
HIGH |
LOW |
CLOSE |
PREV.CLOSE |
CHANGE |
%CHANGE |
|
0.91642 |
0.91885 |
0.91466 |
0.91575 |
0.91642 |
-0.00067 |
-0.08% |
|
DAILY PIVOT POINT |
||||||
|
R3 |
R2 |
R1 |
PIVOT |
S1 |
S2 |
S3 |
|
0.92230 |
0.92060 |
0.91810 |
0.91640 |
0.91400 |
0.91220 |
0.90980 |
USDJPY
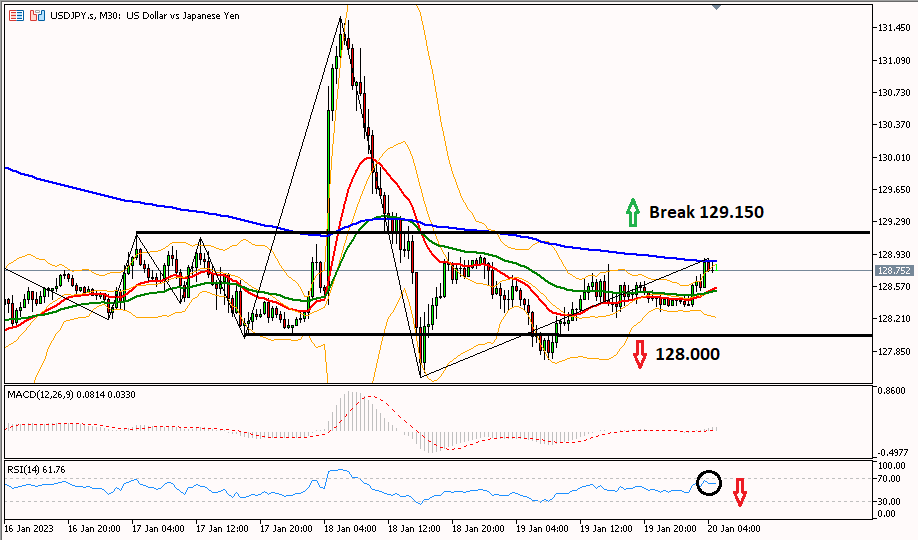
Daily technical analysis for USD/JPY has a chance to rise further, as seen from the chart that has touched the MA200 in the 30-minute period. It needs to break the 129.150 area to rise further until the next resistance at 129.620. Meanwhile, if the USD/JPY pair is able to break through the 128.00 support again, then the bearish trend will continue until the 127.340 support. The decline was also supported by the RSI which is already in the overbought area.
|
PREVIOUS RANGE |
||||||
|
OPEN |
HIGH |
LOW |
CLOSE |
PREV.CLOSE |
CHANGE |
%CHANGE |
|
128.878 |
128.892 |
127.755 |
128.410 |
128.896 |
-0.486 |
-0.38% |
|
DAILY PIVOT POINT |
||||||
|
R3 |
R2 |
R1 |
PIVOT |
S1 |
S2 |
S3 |
|
130.340 |
129.620 |
129.210 |
128.480 |
128.070 |
127.340 |
126.930 |
XUL (LOCO LONDON GOLD)
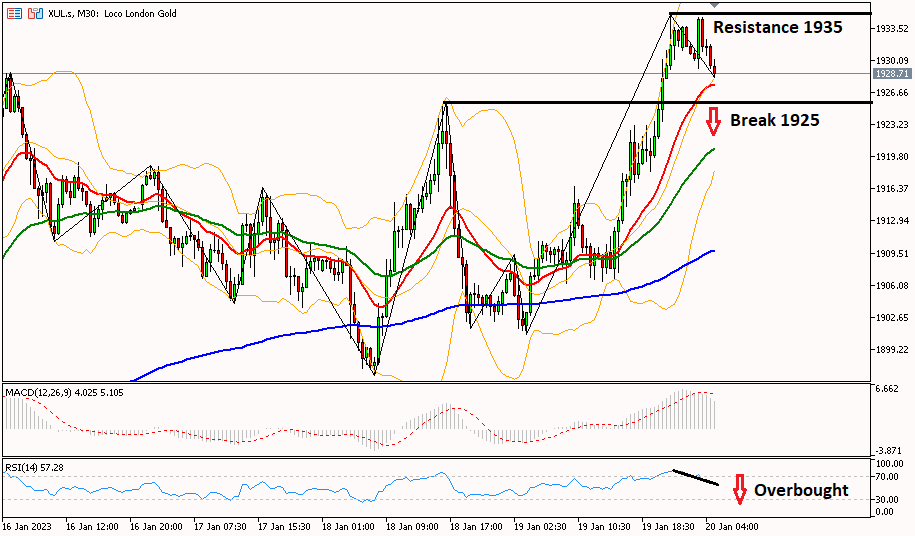
Daily technical analysis for gold price is trying to test the 1925.00 support area supported by the RSI indicator which is already in the overbought area towards the next support at 1918.00. However, if gold manages to break the resistance at 1935.00 again, then the price will have a chance to reach the psychological resistance/key 1950.
|
PREVIOUS RANGE |
||||||
|
OPEN |
HIGH |
LOW |
CLOSE |
PREV.CLOSE |
CHANGE |
%CHANGE |
|
1904.08 |
1935.00 |
1900.82 |
1932.28 |
1904.29 |
27.99 |
1.47% |
|
DAILY PIVOT POINT |
||||||
|
R3 |
R2 |
R1 |
PIVOT |
S1 |
S2 |
S3 |
|
1969.40 |
1952.20 |
1935.20 |
1918.00 |
1901.00 |
1883.80 |
1866.80 |
CLSK (OIL)
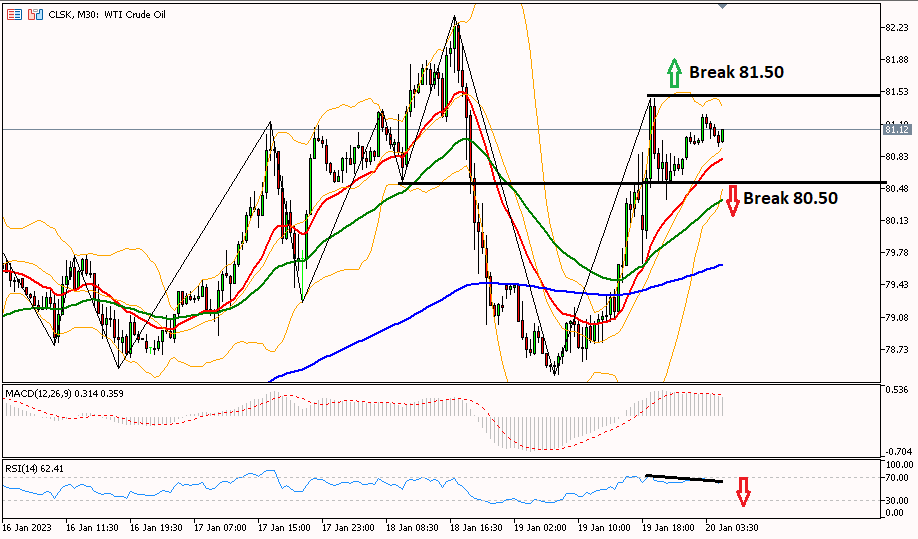
A break of the resistance level at 81.50 is needed for oil to continue the bullish streak, with the next resistance target at 83.25. However, referring to the RSI indicator which is already in the overbought area, oil has the potential to correct or be biased to become bearish after passing the support area at 80.50 to the next support at 79.00.
|
PREVIOUS RANGE |
||||||
|
OPEN |
HIGH |
LOW |
CLOSE |
PREV.CLOSE |
CHANGE |
%CHANGE |
|
79.42 |
81.46 |
78.45 |
80.79 |
79.18 |
1.61 |
2.03% |
|
DAILY PIVOT POINT |
||||||
|
R3 |
R2 |
R1 |
PIVOT |
S1 |
S2 |
S3 |
|
85.02 |
83.24 |
82.01 |
80.23 |
79.00 |
77.22 |
75.99 |
Well, that's the explanation of "Technical Daily Analysis: January 20, 2023 – Recession Sentiment Weighs on the Greenback,". Also read our other articles, such as an explanation of how to buy cryptocurrencies, only in the GIC Journal. Don't forget to practice your trading skills by getting the Scalping Ebook and following Live Trading on NFP Live Trading. Make sure, download GIC Mobile Apps on the Google Play Store.


