 Last:
Last: 
The following is a technical daily analysis, January 17, 2023. The data and analysis contained in this newsletter can be used on a wide scale for your trading. However, it is important to note that GICTrade and its data providers are not responsible for your trading results.
So, it's your own responsibility. Before knowing today's technical analysis, immediately register yourself to take part in the GIC Gebyar Prize and get the main prize, namely Mobile Mitshubshi Expander or Vacation Package to Labuan Bajo for 4 days and 3 nights.
In the following, we will inform you about the forecast of price movements in Forex and Commodities which is equipped with the calculation of Pivot points, Resistance and Support levels.
EURUSD
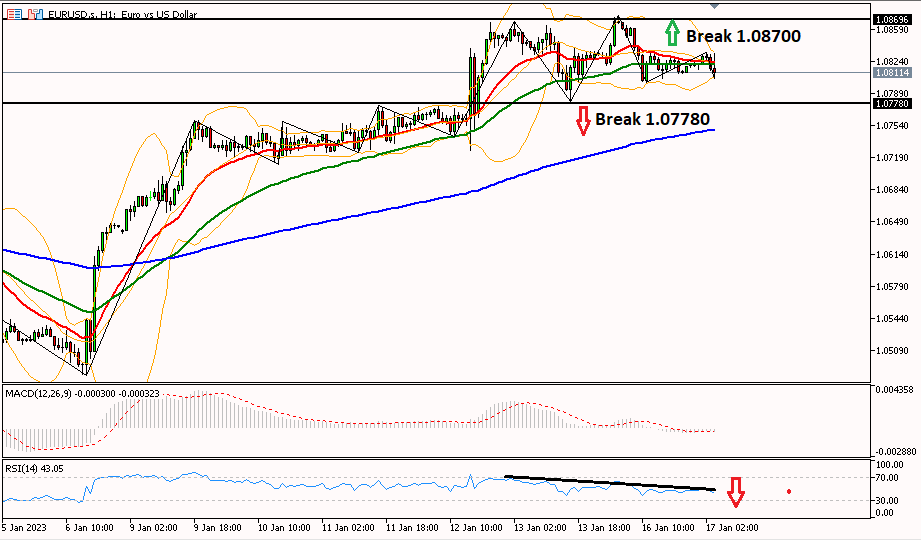
Daily technical analysis for EUR/USD is likely to move downwards or corrections, as seen from the RSI indicator in the 1-hour period which moves down towards the 30 area after being in the 70 area. Moreover, the MA20 line attempting to cross the MA50 line could be an additional support for the euro to move down. It needs a break of support at 1.07780 to change the bias to bearish until the next support in the 1.07160 area.
|
PREVIOUS RANGE |
||||||
|
OPEN |
HIGH |
LOW |
CLOSE |
PREV.CLOSE |
CHANGE |
%CHANGE |
|
1.08284 |
1.08735 |
1.08009 |
1.08203 |
1.08330 |
-0.00127 |
-0.12% |
|
DAILY PIVOT POINT |
||||||
|
R3 |
R2 |
R1 |
PIVOT |
S1 |
S2 |
S3 |
|
1.09340 |
1.09040 |
1.08610 |
1.08310 |
1.07890 |
1.07580 |
1.07160 |
GBPUSD
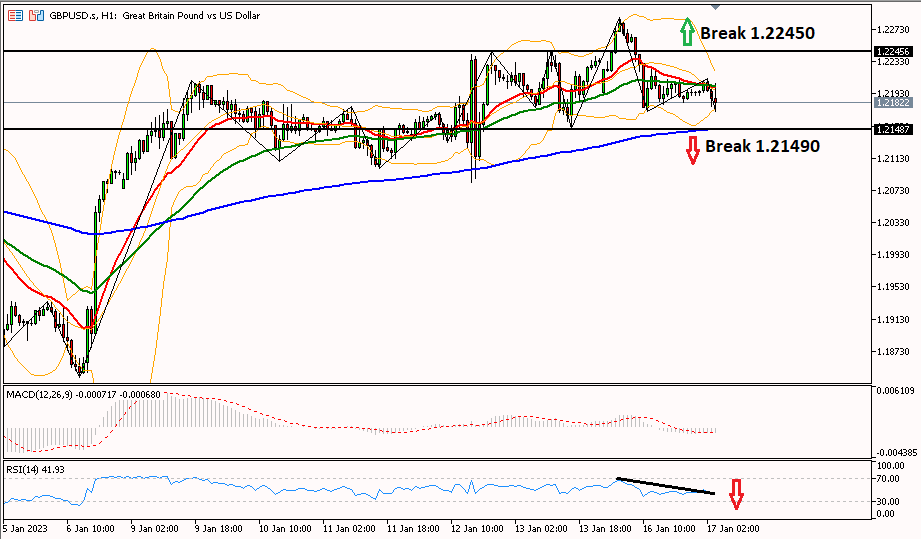
GBP/USD tends to move down or correct, as seen from the RSI indicator in the 1-hour period which moves down towards the 30 area after being in the 70 area. In addition, the MA20 line has already touched the MA50 line and is trying to cross the line, indicating a further decline. Need a break of support at 1.21490 to change bias to bearish until the next support in the 1.20180 area.
|
PREVIOUS RANGE |
||||||
|
OPEN |
HIGH |
LOW |
CLOSE |
PREV.CLOSE |
CHANGE |
%CHANGE |
|
1.21947 |
1.22883 |
1.21708 |
1.21951 |
1.22347 |
-0.00396 |
-0.33% |
|
DAILY PIVOT POINT |
||||||
|
R3 |
R2 |
R1 |
PIVOT |
S1 |
S2 |
S3 |
|
1.23710 |
1.23300 |
1.22530 |
1.22120 |
1.21360 |
1.20950 |
1.20180 |
AUDUSD
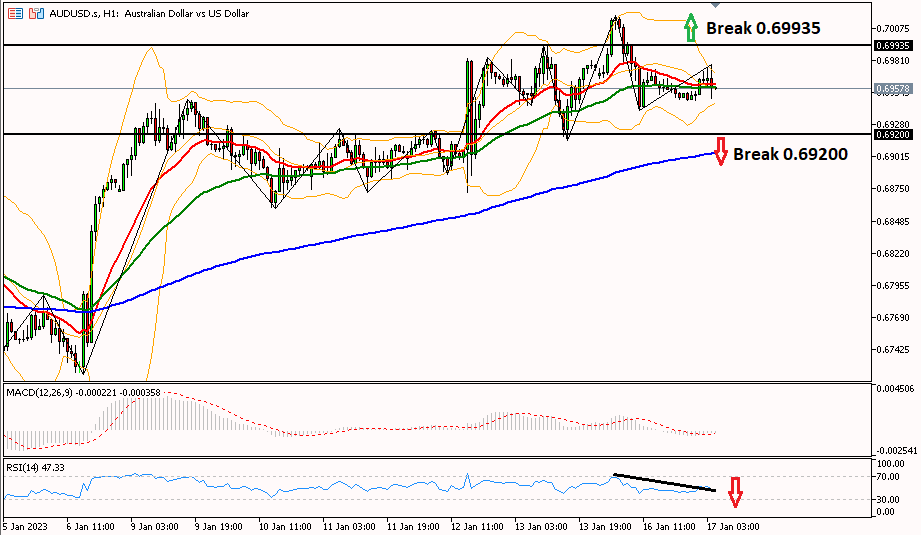
AUD/USD has a chance to fall, as seen from the RSI indicator in the 1-hour period which moved down towards the 30 area after being in the 70 area. In addition, the MA20 line has already touched the MA50 line and is trying to cross the line, indicating a further decline. It needs a break of support at 0.69200 to change the bias to bearish until the next support in the 0.68430 area.
|
PREVIOUS RANGE |
||||||
|
OPEN |
HIGH |
LOW |
CLOSE |
PREV.CLOSE |
CHANGE |
%CHANGE |
|
0.69690 |
0.70184 |
0.69400 |
0.69524 |
0.69755 |
-0.00231 |
-0.33% |
|
DAILY PIVOT POINT |
||||||
|
R3 |
R2 |
R1 |
PIVOT |
S1 |
S2 |
S3 |
|
0.70780 |
0.70480 |
0.70000 |
0.69700 |
0.69220 |
0.68920 |
0.68430 |
USDCHF
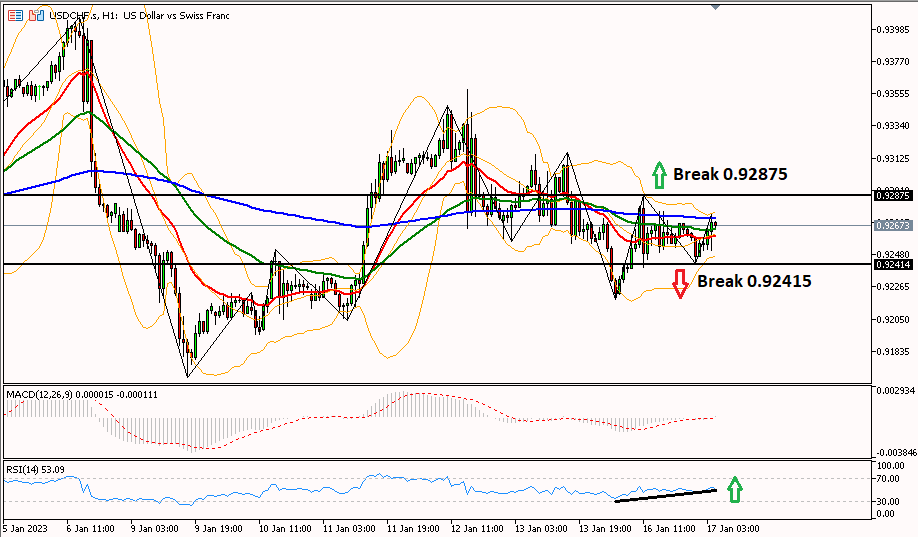
Daily technical analysis for the USD/CHF pair is trying to rebound, as seen from the RSI indicator in the 1-hour period moving upwards towards the 70 area after being in the oversold area. It needs to break the resistance at 0.92875 to change the bias to bullish until the next resistance in the 0.93640 area.
|
PREVIOUS RANGE |
||||||
|
OPEN |
HIGH |
LOW |
CLOSE |
PREV.CLOSE |
CHANGE |
%CHANGE |
|
0.92579 |
0.92875 |
0.92179 |
0.92596 |
0.92571 |
0.00025 |
0.02% |
|
DAILY PIVOT POINT |
||||||
|
R3 |
R2 |
R1 |
PIVOT |
S1 |
S2 |
S3 |
|
0.93640 |
0.93260 |
0.92940 |
0.92560 |
0.92250 |
0.91860 |
0.91550 |
USDJPY
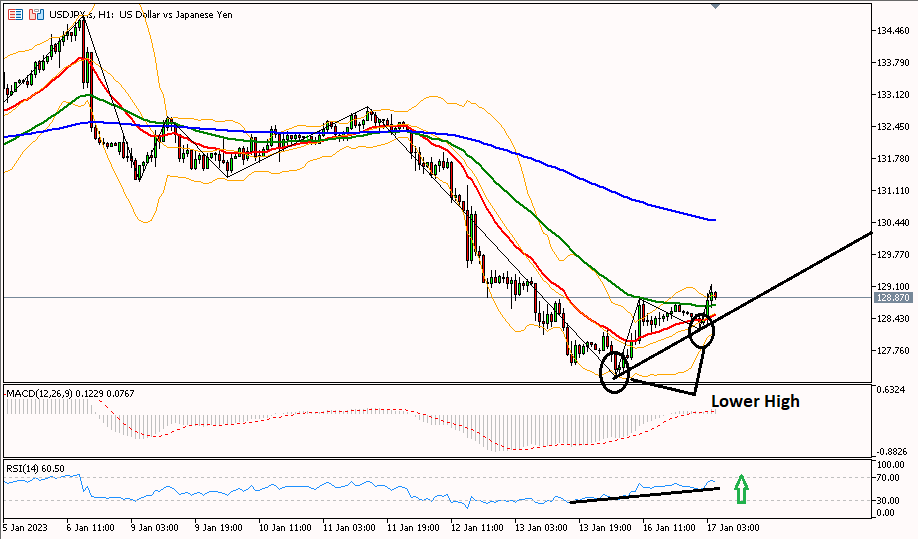
USD/JPY has the potential to rebound in the 1-hour period seen from the lower high. It needs to break the 129,720 area to change the bias to bullish with the next target or S3 at 130,580.
|
PREVIOUS RANGE |
||||||
|
OPEN |
HIGH |
LOW |
CLOSE |
PREV.CLOSE |
CHANGE |
%CHANGE |
|
127.757 |
128.858 |
127.217 |
128.476 |
127.778 |
0.698 |
0.55% |
|
DAILY PIVOT POINT |
||||||
|
R3 |
R2 |
R1 |
PIVOT |
S1 |
S2 |
S3 |
|
130.580 |
129.720 |
128.940 |
128.080 |
127.300 |
126.440 |
125.660 |
XUL (LOCO LONDON GOLD)
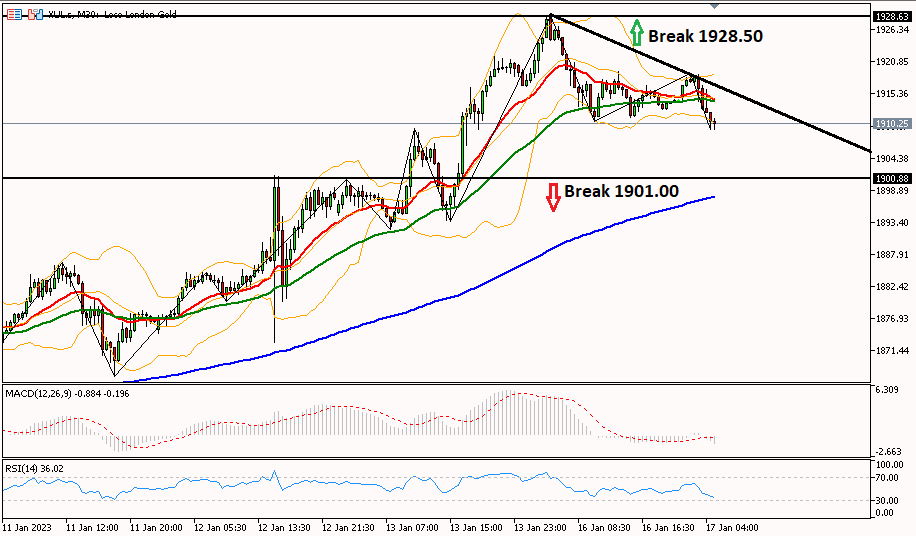
Daily technical analysis for gold prices has the potential to be corrected, as seen from the lower high price (Higher Low) indicates a downward trend. The prelu break the 1901.00 area for gold changed the bias to bearish with the next support target in the 1890.10 area. However, if gold is able to break through the resistance area of 1928.50, the uptrend will strengthen until it reaches the second resistance at 1926.60.
|
PREVIOUS RANGE |
||||||
|
OPEN |
HIGH |
LOW |
CLOSE |
PREV.CLOSE |
CHANGE |
%CHANGE |
|
1920.20 |
1928.80 |
1910.73 |
1914.32 |
1919.81 |
-5.49 |
-0.29% |
|
DAILY PIVOT POINT |
||||||
|
R3 |
R2 |
R1 |
PIVOT |
S1 |
S2 |
S3 |
|
1944.30 |
1936.60 |
1926.30 |
1918.50 |
1908.20 |
1900.40 |
1890.10 |
CLSK (OIL)
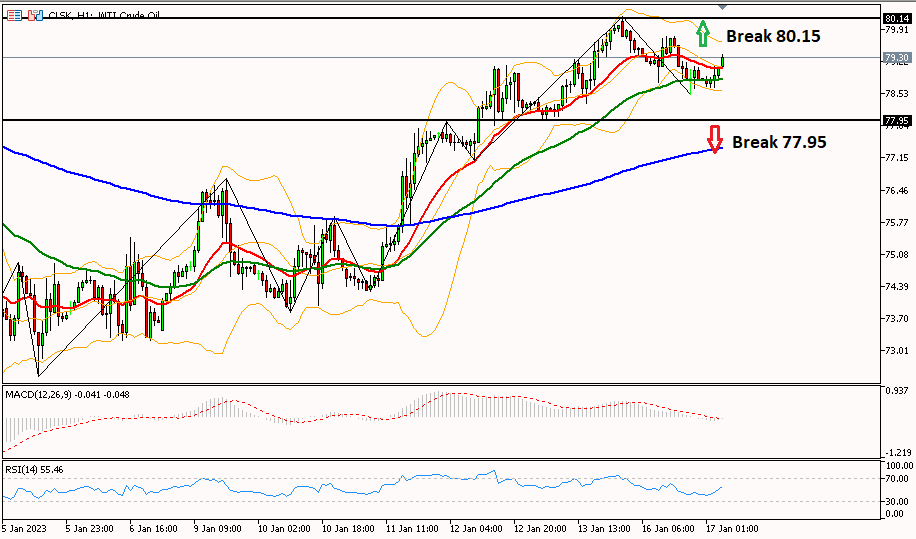
It is necessary to break one of the resistance and support levels for oil to see the next trend. To continue the increase, it is necessary to pass through the resistance area at 80.15 first to R3 at 81.50. Meanwhile, to change the bias to bearish, it is necessary to pass the support at 77.95 to the next support at 76.52.
|
PREVIOUS RANGE |
||||||
|
OPEN |
HIGH |
LOW |
CLOSE |
PREV.CLOSE |
CHANGE |
%CHANGE |
|
80.08 |
80.18 |
78.52 |
78.84 |
79.99 |
-1.15 |
-1.44% |
|
DAILY PIVOT POINT |
||||||
|
R3 |
R2 |
R1 |
PIVOT |
S1 |
S2 |
S3 |
|
81.50 |
80.84 |
79.84 |
79.18 |
78.18 |
77.52 |
76.52 |
So, that's the explanation of "Technical Daily Analysis: January 17, 2023 – Greenback Tries to Rebound". Also read our other articles, such as an explanation of how to buy cryptocurrencies, only in the GIC Journal. Don't forget to practice your trading skills by getting the Scalping Ebook and following Live Trading on NFP Live Trading. Make sure, download GIC Mobile Apps on the Google Play Store.


