 Last:
Last: 
The following is a daily technical analysis, January 12, 2023. The data and analysis contained in this newsletter can be used on a wide scale for your trading. However, it is important to note that GICTrade and its data providers are not responsible for your trading results.
So, it's your own responsibility. Before knowing today's technical analysis, immediately register yourself to take part in the GIC Gebyar Prize and get the main prize, namely Mobile Mitshubshi Expander or Vacation Package to Labuan Bajo for 4 days and 3 nights.
In the following, we will inform you about the forecast of price movements in Forex and Commodities which is equipped with the calculation of Pivot points, Resistance and Support levels.
EURUSD
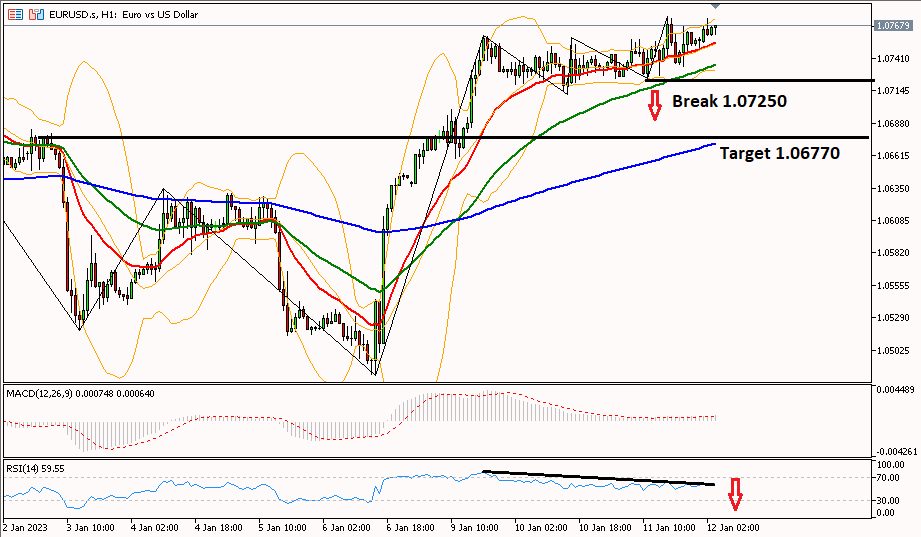
Daily technical analysis for EUR/USD is still in an uptrend, it needs a break of resistance (R2) 1.07980 to continue bullish to the 1.08200 area. However, referring to the RSI indicator which is already in the overbought area, the euro has the opportunity to correct after breaking through the 1.07250 area towards the target of 1.06770 to the support (S3) at 1.06680.
|
PREVIOUS RANGE |
||||||
|
OPEN |
HIGH |
LOW |
CLOSE |
PREV.CLOSE |
CHANGE |
%CHANGE |
|
1.07335 |
1.07756 |
1.07249 |
1.07554 |
1.07335 |
0.00219 |
0.20% |
|
DAILY PIVOT POINT |
||||||
|
R3 |
R2 |
R1 |
PIVOT |
S1 |
S2 |
S3 |
|
1.08200 |
1.07980 |
1.07690 |
1.07470 |
1.07180 |
1.06960 |
1.06680 |
GBPUSD
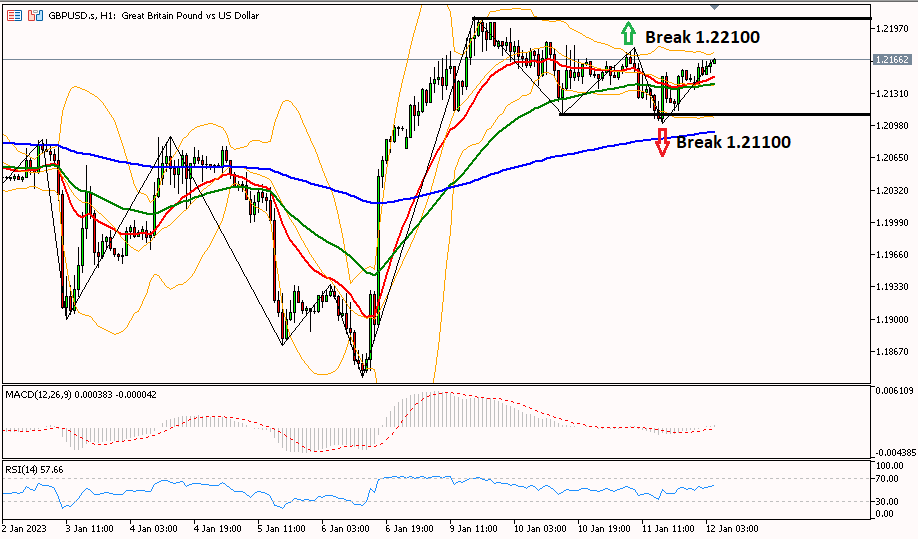
GBP/USD is still in a sideways or flat movement, it needs to break one of the resistance and support levels. If GBP/USD is able to break through the 1.22100 area, the bullish trend will continue until the next resistance area at 1.22660. However, if the 1.21100 area breaks then the bias turns bearish towards the next support at the level of 1.20330.
|
PREVIOUS RANGE |
||||||
|
OPEN |
HIGH |
LOW |
CLOSE |
PREV.CLOSE |
CHANGE |
%CHANGE |
|
1.21503 |
1.21776 |
1.20997 |
1.21467 |
1.21497 |
-0.00030 |
-0.02% |
|
DAILY PIVOT POINT |
||||||
|
R3 |
R2 |
R1 |
PIVOT |
S1 |
S2 |
S3 |
|
1.22660 |
1.22220 |
1.21880 |
1.21440 |
1.21100 |
1.20660 |
1.20330 |
AUDUSD
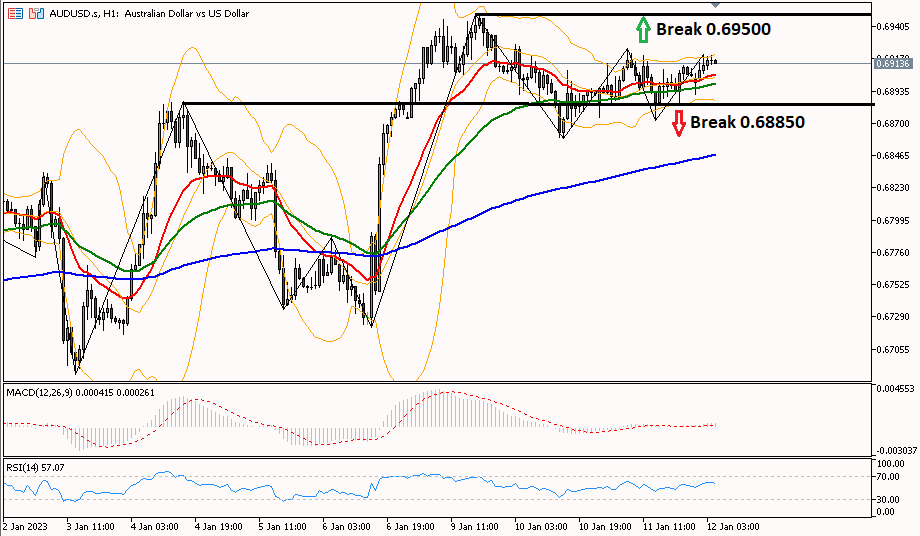
AUD/USD in the 1-hour period tends to move sideways or flat, as seen from the Boillenger Band (BB) indicator parallel between the upper BB and the lower BB. The Aussie is trying to rise further, needing to cross the 0.69500 area to the next resistance at 0.69740. However, to change the bias to bearish it is necessary to break the 0.68850 area to the next support at 0.68170.
|
PREVIOUS RANGE |
||||||
|
OPEN |
HIGH |
LOW |
CLOSE |
PREV.CLOSE |
CHANGE |
%CHANGE |
|
0.68854 |
0.69248 |
0.68723 |
0.69049 |
0.68918 |
0.00131 |
0.19% |
|
DAILY PIVOT POINT |
||||||
|
R3 |
R2 |
R1 |
PIVOT |
S1 |
S2 |
S3 |
|
0.69740 |
0.69500 |
0.69220 |
0.68970 |
0.68690 |
0.68450 |
0.68170 |
USDCHF
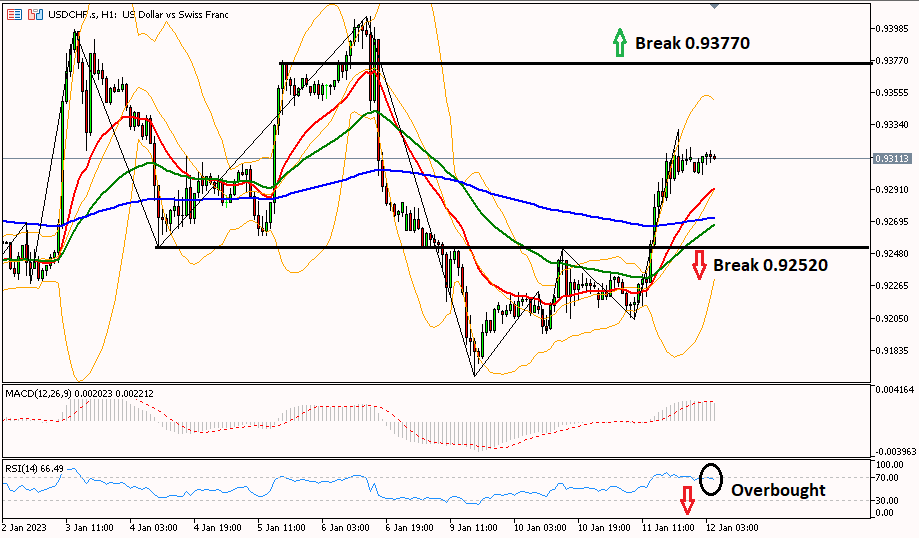
The USD/CHF pair tried to move up after the MA20 line crossed the MA200 line from below in the 1-hour period. It needs a break of the 0.93770 level to continue the rise to the resistance of 0.94570. However, the RSI indicator is already in the overbought area, so the franc has a chance to fall. It needs to break the 0.92520 area until the next support at 0.92030.
|
PREVIOUS RANGE |
||||||
|
OPEN |
HIGH |
LOW |
CLOSE |
PREV.CLOSE |
CHANGE |
%CHANGE |
|
0.92213 |
0.93310 |
0.92039 |
0.93122 |
0.92259 |
0.00863 |
0.93% |
|
DAILY PIVOT POINT |
||||||
|
R3 |
R2 |
R1 |
PIVOT |
S1 |
S2 |
S3 |
|
0.94570 |
0.93940 |
0.93300 |
0.92670 |
0.92030 |
0.91400 |
0.90760 |
USDJPY
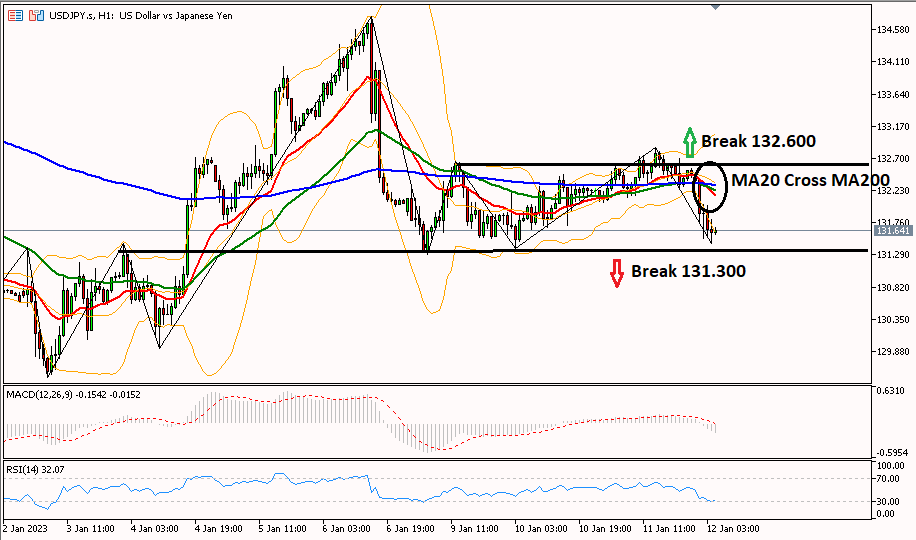
Daily technical analysis for USD/JPY is observed moving downwards, trying to break through the 131,300 area to the next support (Q3) at 131,150. The decline in the yen is confirmed by the MA20 line crossing the MA200 line. However, the bias will be bullish if the USD/JPY pair is able to break through the 132,600 area to the next resistance (R2) at 133,220.
|
PREVIOUS RANGE |
||||||
|
OPEN |
HIGH |
LOW |
CLOSE |
PREV.CLOSE |
CHANGE |
%CHANGE |
|
132.228 |
132.866 |
132.060 |
132.482 |
132.229 |
0.253 |
0.19% |
|
DAILY PIVOT POINT |
||||||
|
R3 |
R2 |
R1 |
PIVOT |
S1 |
S2 |
S3 |
|
133.570 |
133.220 |
132.760 |
132.410 |
131.950 |
131.600 |
131.150 |
XUL (LOCO LONDON GOLD)
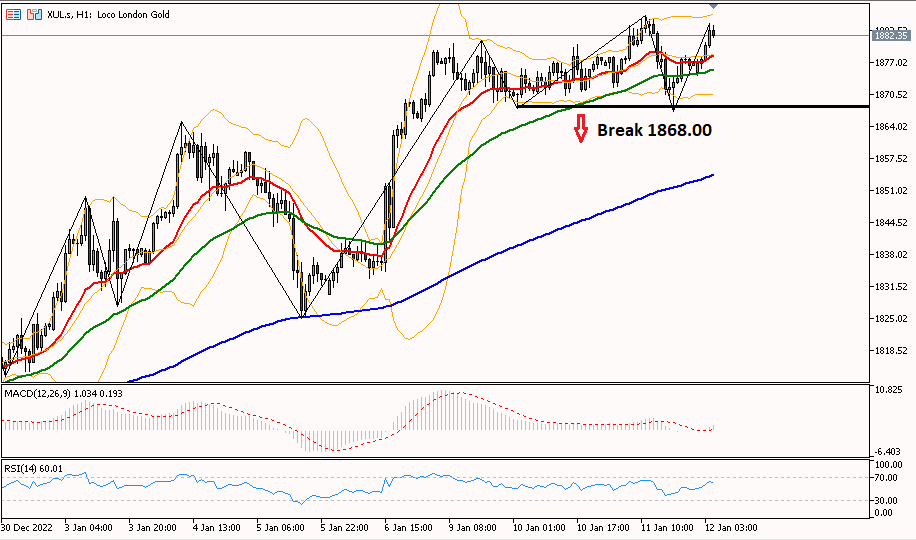
Gold prices are in a bullish trend towards the 1886.20 area back to resistance (R2) at 1896.10. However, to change the bias to bearish, the gold price needs to pass through the 1868.00 area to the next support area at 1857.10.
|
PREVIOUS RANGE |
||||||
|
OPEN |
HIGH |
LOW |
CLOSE |
PREV.CLOSE |
CHANGE |
%CHANGE |
|
1876.33 |
1886.46 |
1866.98 |
1876.66 |
1877.34 |
-0.68 |
-0.04% |
|
DAILY PIVOT POINT |
||||||
|
R3 |
R2 |
R1 |
PIVOT |
S1 |
S2 |
S3 |
|
1905.70 |
1896.10 |
1886.20 |
1876.60 |
1866.70 |
1857.10 |
1847.30 |
CLSK (OIL)
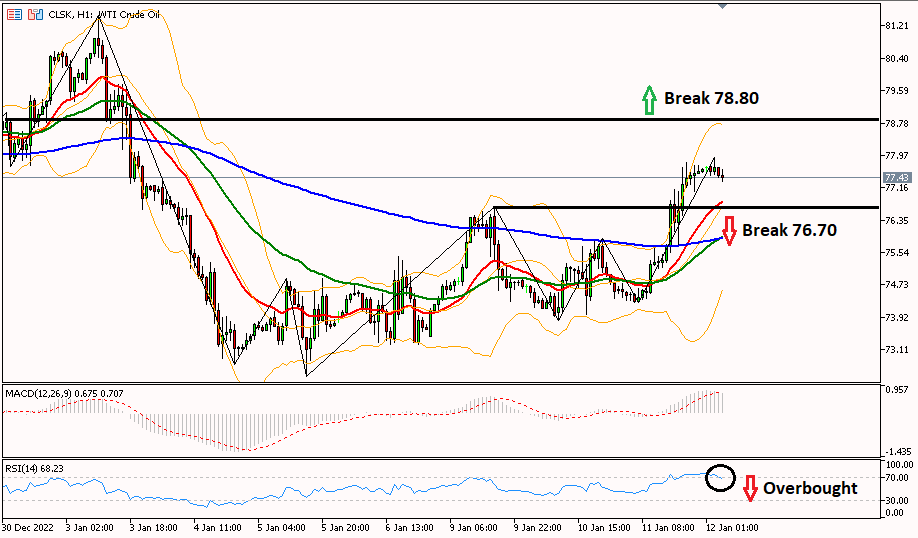
Daily technical analysis for oil prices has the potential to fall, if it is able to break through the 76.70 area towards the next support at 75.35. The decline in oil prices was supported by the 1-hour RSI which moved down. However, further gains need to confirm the 78.70 area as the first resistance to head towards the next resistance (R2) at 80.00.
|
PREVIOUS RANGE |
||||||
|
OPEN |
HIGH |
LOW |
CLOSE |
PREV.CLOSE |
CHANGE |
%CHANGE |
|
74.76 |
77.79 |
74.29 |
77.63 |
74.79 |
2.84 |
3.80% |
|
DAILY PIVOT POINT |
||||||
|
R3 |
R2 |
R1 |
PIVOT |
S1 |
S2 |
S3 |
|
82.35 |
80.07 |
78.85 |
76.57 |
75.35 |
73.07 |
71.85 |
So, that's the explanation of "Technical Daily Analysis: January 12, 2023 – US Dollar Moving Sideways". Also read our other articles, such as an explanation of how to buy cryptocurrencies, only in the GIC Journal. Don't forget to practice your trading skills by getting the Scalping Ebook and following Live Trading on NFP Live Trading. Make sure, download GIC Mobile Apps on the Google Play Store.


