 Last:
Last: 
The following is a daily technical analysis, January 11, 2023. The data and analysis contained in this newsletter can be used on a wide scale for your trading. However, it is important to note that GICTrade and its data providers are not responsible for your trading results.
So, it's your own responsibility. Before knowing today's technical analysis, immediately register yourself to take part in the GIC Gebyar Prize and get the main prize, namely Mobile Mitshubshi Expander or Vacation Package to Labuan Bajo for 4 days and 3 nights.
In the following, we will inform you about the forecast of price movements in Forex and Commodities which is equipped with the calculation of Pivot points, Resistance and Support levels.
EURUSD
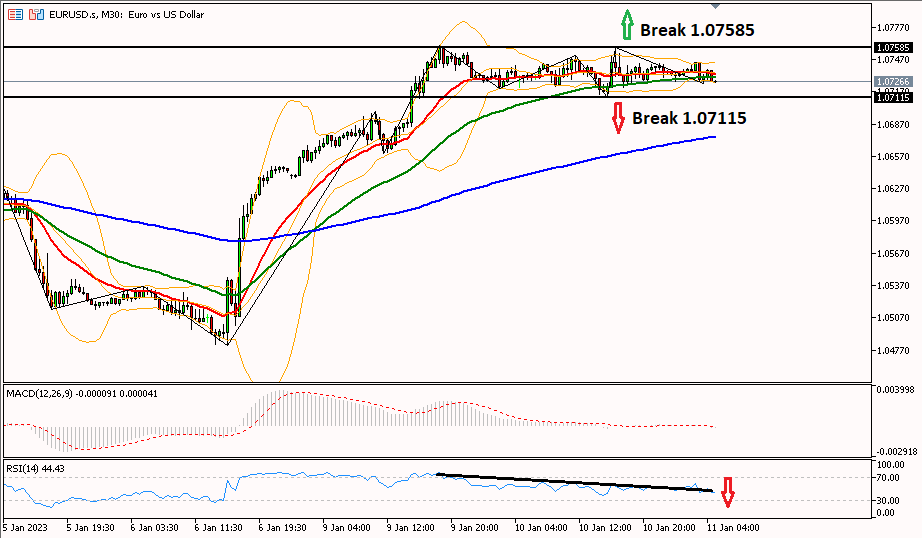
Daily Technical Analysis for EUR/USD is still in a sideways or flat movement, it needs to break one of the resistance and support levels. If EUR/USD is able to break through the 1.07585 area then the bullish trend will continue until the next resistance area at 1.08030. However, if the 1.07115 area breaks, the bias turns bearish towards the next support at the level of 1.06630.
|
PREVIOUS RANGE |
||||||
|
OPEN |
HIGH |
LOW |
CLOSE |
PREV.CLOSE |
CHANGE |
%CHANGE |
|
1.07318 |
1.07585 |
1.07115 |
1.07335 |
1.07318 |
0.00017 |
0.02% |
|
DAILY PIVOT POINT |
||||||
|
R3 |
R2 |
R1 |
PIVOT |
S1 |
S2 |
S3 |
|
1.08030 |
1.07810 |
1.07570 |
1.07340 |
1.07100 |
1.06870 |
1.06630 |
GBPUSD
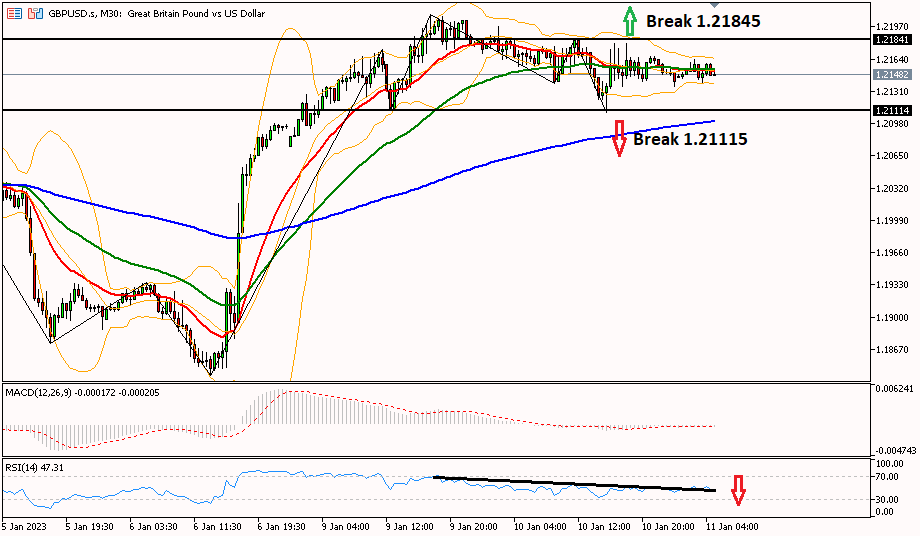
GBP/USD is still in a sideways or flat movement, it needs to break one of the resistance and support levels. If GBP/USD is able to break through the 1.21845 area, the bullish trend will continue until the next resistance area at 1.22480. However, if the 1.21115 area breaks then the bias turns bearish towards the next support at the level of 1.20350.
|
PREVIOUS RANGE |
||||||
|
OPEN |
HIGH |
LOW |
CLOSE |
PREV.CLOSE |
CHANGE |
%CHANGE |
|
1.21841 |
1.21971 |
1.21093 |
1.21497 |
1.21841 |
-0.00344 |
-0.28% |
|
DAILY PIVOT POINT |
||||||
|
R3 |
R2 |
R1 |
PIVOT |
S1 |
S2 |
S3 |
|
1.22990 |
1.22480 |
1.22110 |
1.21600 |
1.21230 |
1.20720 |
1.20350 |
AUDUSD
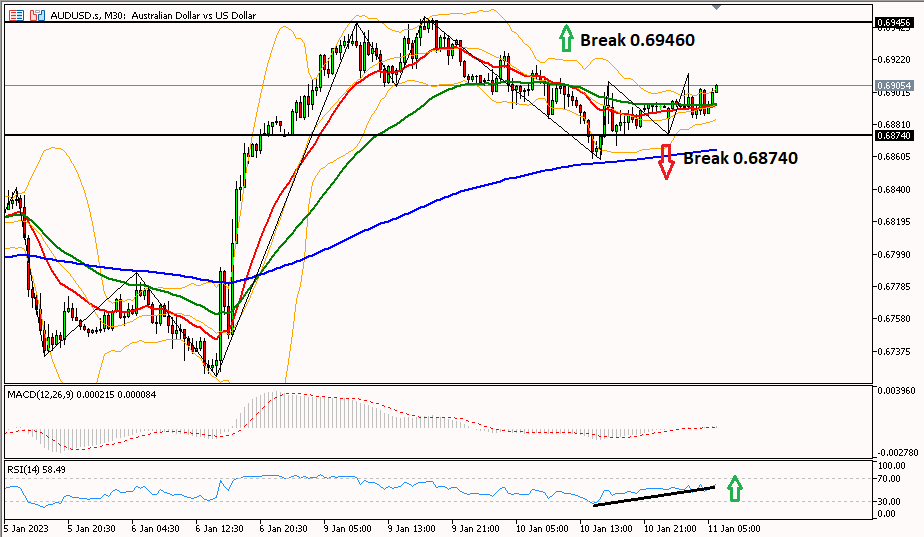
Daily Technical Analysis for the AUD/USD pair in the 30-minute period has the potential to rise further after crossing the 0.69460 area to the next resistance at 0.70030. The Aussie rally was also supported by the RSI indicator which moved to the 70 RSI level after being in the oversold area. To change the bias to bearish it is necessary to break the area of 0.68740 to the next support at 0.67990.
|
PREVIOUS RANGE |
||||||
|
OPEN |
HIGH |
LOW |
CLOSE |
PREV.CLOSE |
CHANGE |
%CHANGE |
|
0.69114 |
0.69271 |
0.68591 |
0.68918 |
0.69114 |
-0.00196 |
-0.28% |
|
DAILY PIVOT POINT |
||||||
|
R3 |
R2 |
R1 |
PIVOT |
S1 |
S2 |
S3 |
|
0.70030 |
0.69650 |
0.69350 |
0.68970 |
0.68670 |
0.68290 |
0.67990 |
USDCHF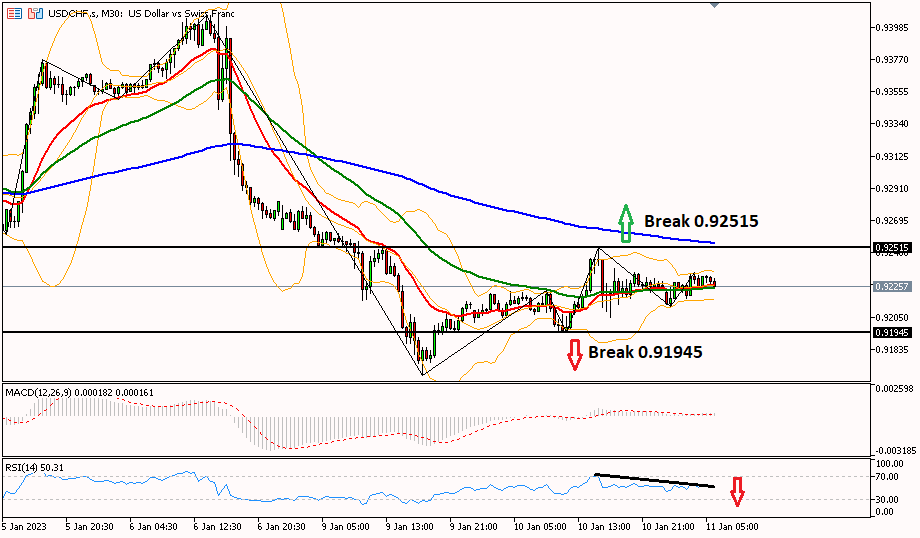
The USD/CHF pair was observed to move flat or sideways. It needs a break of the 0.91945 level to continue the decline until the next support at 0.91320. The bearish trend is also supported by the RSI which is moving downwards towards the 20 RSI level. Meanwhile, to change the bias to bullish, it is necessary to bfreak the area of 0.92515 to the next resistance at 0.93020.
|
PREVIOUS RANGE |
||||||
|
OPEN |
HIGH |
LOW |
CLOSE |
PREV.CLOSE |
CHANGE |
%CHANGE |
|
0.92092 |
0.92514 |
0.91945 |
0.92259 |
0.92132 |
0.00127 |
0.14% |
|
DAILY PIVOT POINT |
||||||
|
R3 |
R2 |
R1 |
PIVOT |
S1 |
S2 |
S3 |
|
0.93020 |
0.92770 |
0.92460 |
0.92200 |
0.91890 |
0.91630 |
0.91320 |
USDJPY
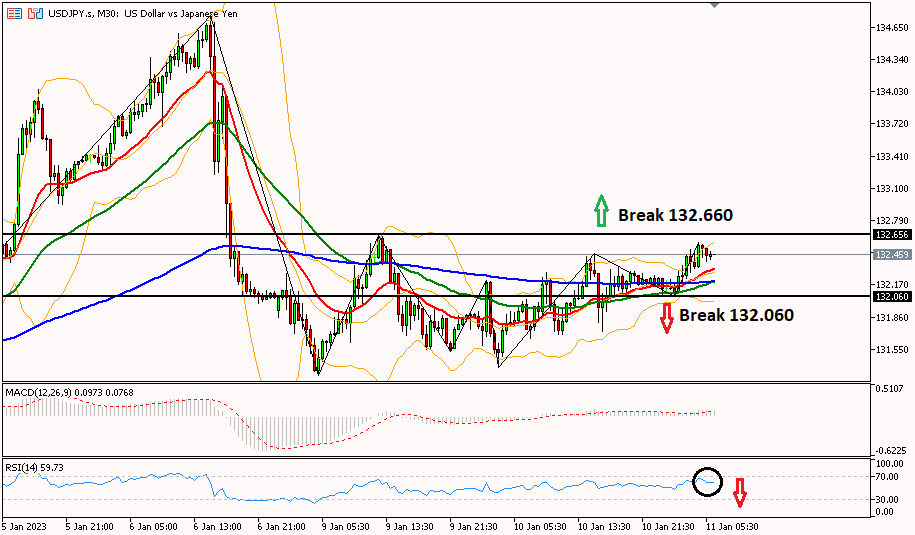
USD/JPY is trying to move up or rebound towards the resistance of 132,660 to 133,700. However, the bearish trend will be strong after the USD/JPY pair is able to break through the 132,060 area to the next support at 130,900.
|
PREVIOUS RANGE |
||||||
|
OPEN |
HIGH |
LOW |
CLOSE |
PREV.CLOSE |
CHANGE |
%CHANGE |
|
131.872 |
132.471 |
131.378 |
132.229 |
131.872 |
0.357 |
0.27% |
|
DAILY PIVOT POINT |
||||||
|
R3 |
R2 |
R1 |
PIVOT |
S1 |
S2 |
S3 |
|
133.700 |
133.080 |
132.600 |
131.990 |
131.510 |
130.900 |
130.420 |
XUL (LOCO LONDON GOLD)
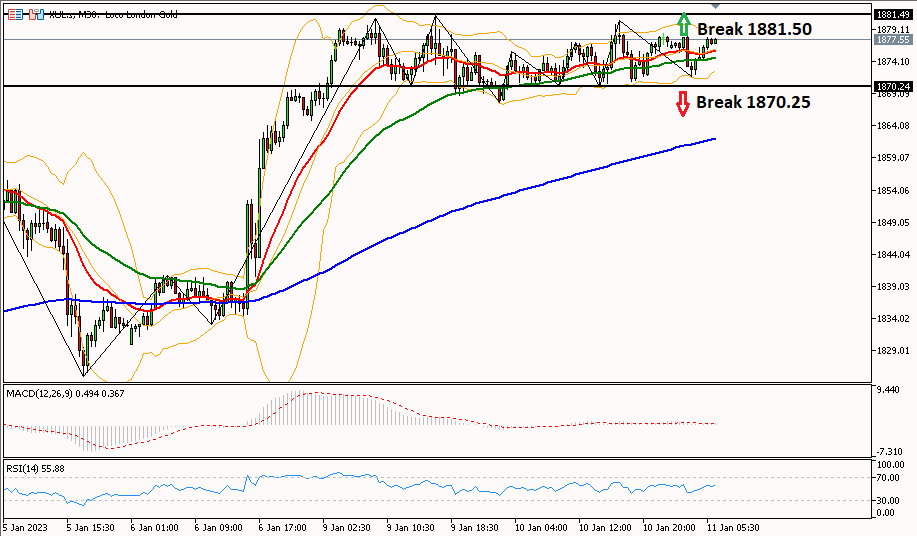
Daily Technical Analysis for gold prices is still in a narrow range, to see the next trend it is necessary to break one of the resistance support levels. To continue the increase in gold prices, it is necessary to break the area of 1881.50 to the next resistance at 1893.40. However, if the 1870.25 area can be crossed again, then the bias turns bearish towards the next support at 1861.20.
|
PREVIOUS RANGE |
||||||
|
OPEN |
HIGH |
LOW |
CLOSE |
PREV.CLOSE |
CHANGE |
%CHANGE |
|
1870.94 |
1880.57 |
1867.67 |
1877.34 |
1871.00 |
6.34 |
0.34% |
|
DAILY PIVOT POINT |
||||||
|
R3 |
R2 |
R1 |
PIVOT |
S1 |
S2 |
S3 |
|
1893.40 |
1887.00 |
1880.50 |
1874.10 |
1867.60 |
1861.20 |
1854.70 |
CLSK (OIL)
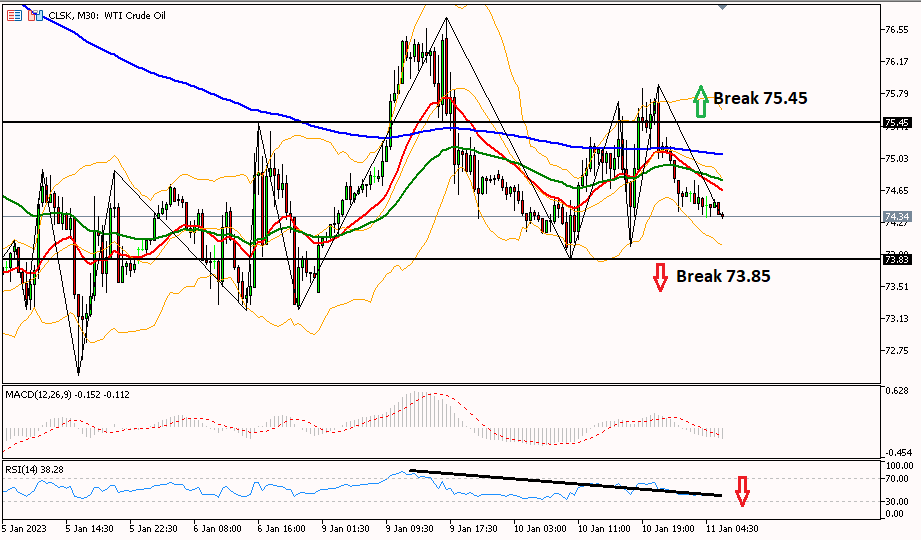
Oil prices have the potential to fall again, if they are able to break through the 73.85 area towards the next support at 72.80. The decline in oil prices was supported by the RSI which moved down towards the 30 RSI level in the 30-minute period. However, the bias will turn bullish if oil prices cross the 75.45 area until the next resistance at 76.90.
|
PREVIOUS RANGE |
||||||
|
OPEN |
HIGH |
LOW |
CLOSE |
PREV.CLOSE |
CHANGE |
%CHANGE |
|
74.84 |
75.90 |
73.83 |
74.79 |
74.79 |
0.00 |
0.00% |
|
DAILY PIVOT POINT |
||||||
|
R3 |
R2 |
R1 |
PIVOT |
S1 |
S2 |
S3 |
|
77.92 |
76.91 |
75.85 |
74.84 |
73.78 |
72.77 |
71.71 |
So, that's the explanation of "Technical Daily Analysis: January 11, 2023 – Greenback Fluctuations, Waiting for US Inflation Data". Also read our other articles, such as an explanation of how to buy cryptocurrencies, only in the GIC Journal. Don't forget to practice your trading skills by getting the Scalping Ebook and following Live Trading on NFP Live Trading. Make sure, download GIC Mobile Apps on the Google Play Store.


