 Last:
Last: 
The following is a daily technical analysis, February 7, 2023. The data and analysis contained in this newsletter can be used on a wide scale for your trading. However, it is important to note that GICTrade and its data providers are not responsible for your trading results.
So, it's your own responsibility. Before knowing today's technical analysis, immediately register yourself to take part in the GIC Gebyar Prize and get the main prize, namely Mobile Mitshubshi Expander or Vacation Package to Labuan Bajo for 4 days and 3 nights.
In the following, we will inform you about the forecast of price movements in Forex and Commodities which is equipped with the calculation of Pivot points, Resistance and Support levels.
EURUSD
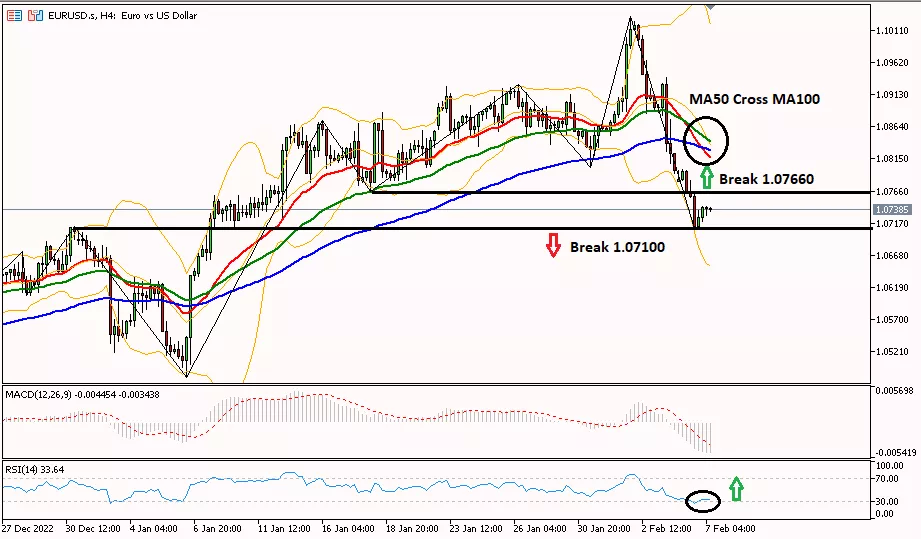
EUR/USD on the 4-hour period tried to rebound after the RSI indicator was already in the oversold area. To change the bias to bullish, it is necessary to break the 1.07660 area first towards the R1 target at 1.07970. However, if EUR/USD manages to cross 1.07100, then the bearish trend continues to the support level of 1.06640, which is also confirmed by the MA50 line that has crossed the MA100 line.
|
PREVIOUS RANGE |
||||||
|
OPEN |
HIGH |
LOW |
CLOSE |
PREV.CLOSE |
CHANGE |
%CHANGE |
|
1.07812 |
1.07983 |
1.07088 |
1.07250 |
1.07980 |
-0.00730 |
-0.68% |
|
DAILY PIVOT POINT |
||||||
|
R3 |
R2 |
R1 |
PIVOT |
S1 |
S2 |
S3 |
|
1.08870 |
1.08420 |
1.07970 |
1.07530 |
1.07080 |
1.06640 |
1.06180 |
GBPUSD
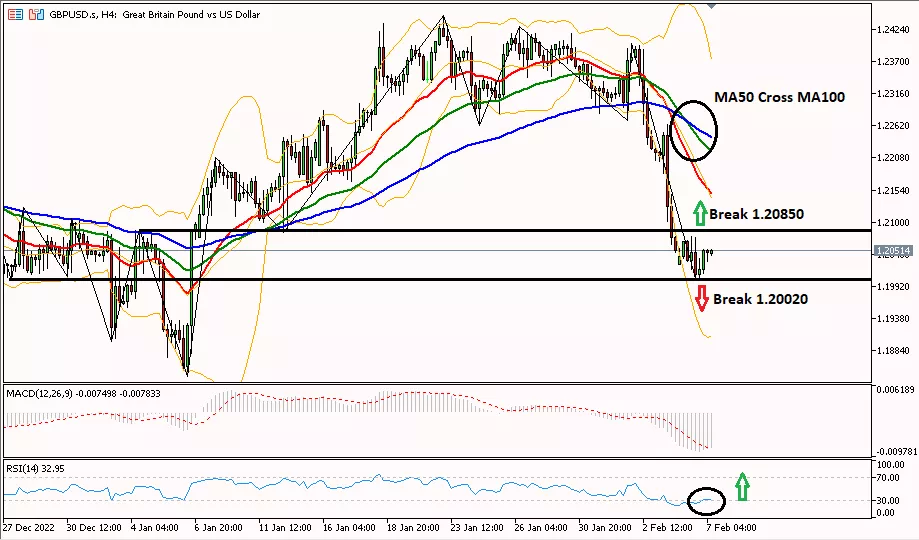
Daily Technical Analysis for the GBP/USD pair is trying to rebound in the 4-hour period marked by the RSI indicator which is already in the oversold area. To change the bias to bullish it is necessary to break the level of 1.20850 towards the target of 1.21320. However, to continue the downtrend, it is necessary to pass the support at 1.20020 first, to test the next support at 1.19620, which is also confirmed by the MA50 line which has crossed the MA100 line.
|
PREVIOUS RANGE |
||||||
|
OPEN |
HIGH |
LOW |
CLOSE |
PREV.CLOSE |
CHANGE |
%CHANGE |
|
1.20280 |
1.20766 |
1.20051 |
1.20208 |
1.20520 |
-0.00312 |
-0.26% |
|
DAILY PIVOT POINT |
||||||
|
R3 |
R2 |
R1 |
PIVOT |
S1 |
S2 |
S3 |
|
1.21320 |
1.21050 |
1.20610 |
1.20330 |
1.19890 |
1.19620 |
1.19180 |
AUDUSD
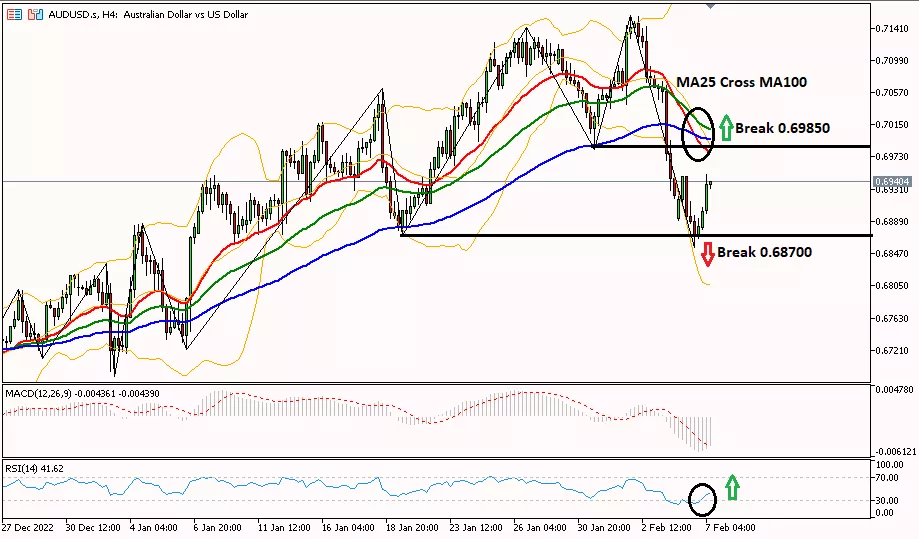
AUD/USD in the 4-hour period is trying to rebound, which is marked by the RSI indicator which is already in the oversold area. To change the bias to bullish, it is necessary to break the level of 0.69850 to test the resistance of 0.70260. However, to continue the downtrend, it is necessary to pass the support at 0.68700, to the next support at 0.68010, which is also confirmed by the MA25 line which has crossed the MA100 line.
|
PREVIOUS RANGE |
||||||
|
OPEN |
HIGH |
LOW |
CLOSE |
PREV.CLOSE |
CHANGE |
%CHANGE |
|
0.68923 |
0.69478 |
0.68548 |
0.68822 |
0.69225 |
-0.00403 |
-0.58% |
|
DAILY PIVOT POINT |
||||||
|
R3 |
R2 |
R1 |
PIVOT |
S1 |
S2 |
S3 |
|
0.70260 |
0.69870 |
0.69330 |
0.68940 |
0.68400 |
0.68010 |
0.67470 |
USDCHF
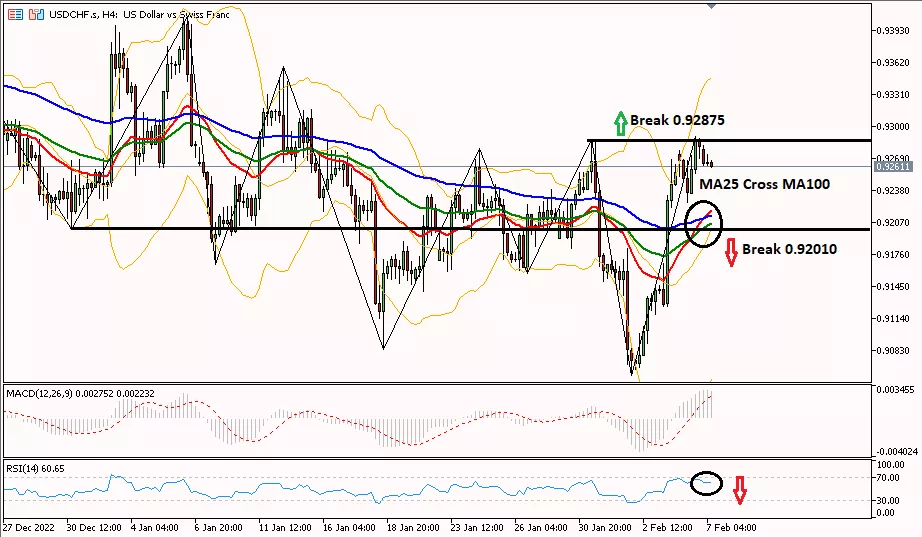
The USD/CHF pair in the 4-hour period is trying to move downwards as seen from the RSI indicator which is already in the overbought area. To change the bias to bearish, it is necessary to break the 0.92010 area to test the support at 0.91810. However, to continue the uptrend USD/CHF needs to cross the 0.92875 level towards the next resistance at 0.93300. The franc's rise is also confirmed by the MA25 line which has crossed the MA100 line.
|
PREVIOUS RANGE |
||||||
|
OPEN |
HIGH |
LOW |
CLOSE |
PREV.CLOSE |
CHANGE |
%CHANGE |
|
0.92725 |
0.92899 |
0.92265 |
0.92810 |
0.92550 |
0.00260 |
0.28% |
|
DAILY PIVOT POINT |
||||||
|
R3 |
R2 |
R1 |
PIVOT |
S1 |
S2 |
S3 |
|
0.93710 |
0.93300 |
0.93080 |
0.92670 |
0.92440 |
0.92040 |
0.91810 |
USDJPY
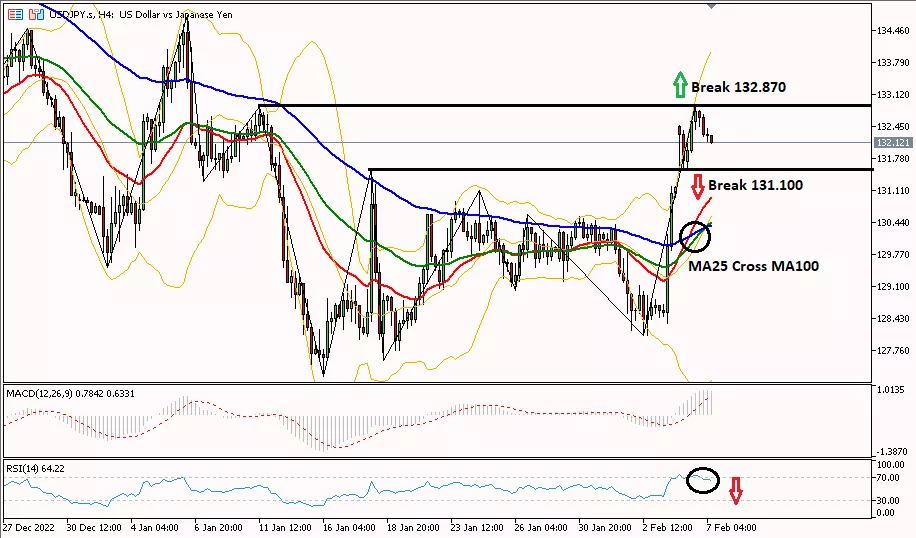
Daily Technical Analysis for the USD/JPY pair in the 4-hour period is trying to move downwards as seen from the RSI indicator which is already in the overbought area. To change the bias to bearish, it is necessary to break the 131,100 area to test the support at 130,450. However, to continue the uptrend USD/JPY needs to cross the level of 132,870 towards the next resistance at 133,760. The rise of the Japanese yen is also confirmed by the MA25 line which has crossed the MA100 line.
|
PREVIOUS RANGE |
||||||
|
OPEN |
HIGH |
LOW |
CLOSE |
PREV.CLOSE |
CHANGE |
%CHANGE |
|
132.446 |
132.897 |
131.507 |
132.626 |
131.180 |
1.446 |
1.11% |
|
DAILY PIVOT POINT |
||||||
|
R3 |
R2 |
R1 |
PIVOT |
S1 |
S2 |
S3 |
|
134.620 |
133.760 |
133.230 |
132.370 |
131.840 |
130.980 |
130.450 |
XUL (LOCO LONDON GOLD)
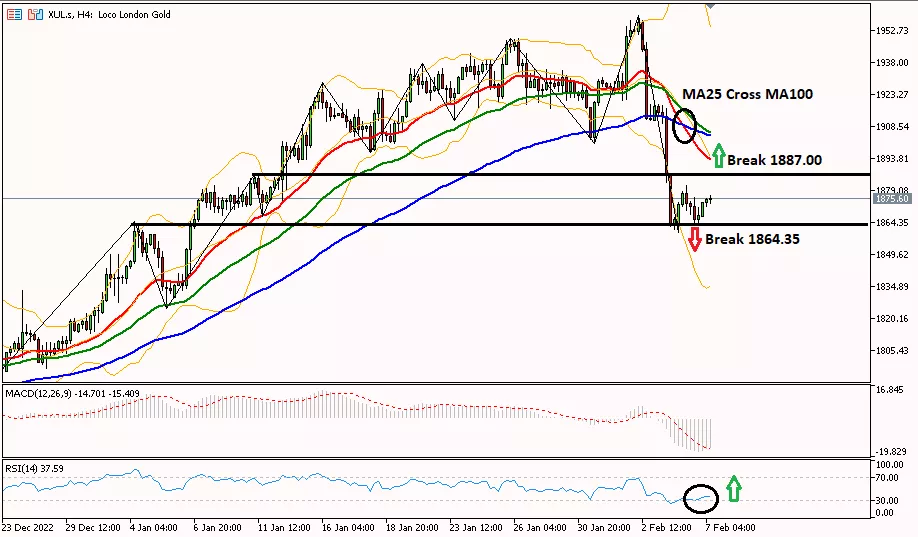
Gold prices in the 4-hour period are trying to rebound, which is marked by the RSI indicator which is already in the oversold area. To change the bias to bullish, it is necessary to break the level of 1887.00 to test the resistance of 1897.90. However, to continue the downtrend, it is necessary to pass the support at 1864.35, to the next support at 1855.40, which is also confirmed by the MA25 line which has crossed the MA100 line.
|
PREVIOUS RANGE |
||||||
|
OPEN |
HIGH |
LOW |
CLOSE |
PREV.CLOSE |
CHANGE |
%CHANGE |
|
1864.54 |
1881.16 |
1859.92 |
1867.45 |
1865.71 |
1.74 |
0.09% |
|
DAILY PIVOT POINT |
||||||
|
R3 |
R2 |
R1 |
PIVOT |
S1 |
S2 |
S3 |
|
1897.90 |
1889.50 |
1876.70 |
1868.30 |
1855.40 |
1847.10 |
1834.20 |
CLSK (OIL)
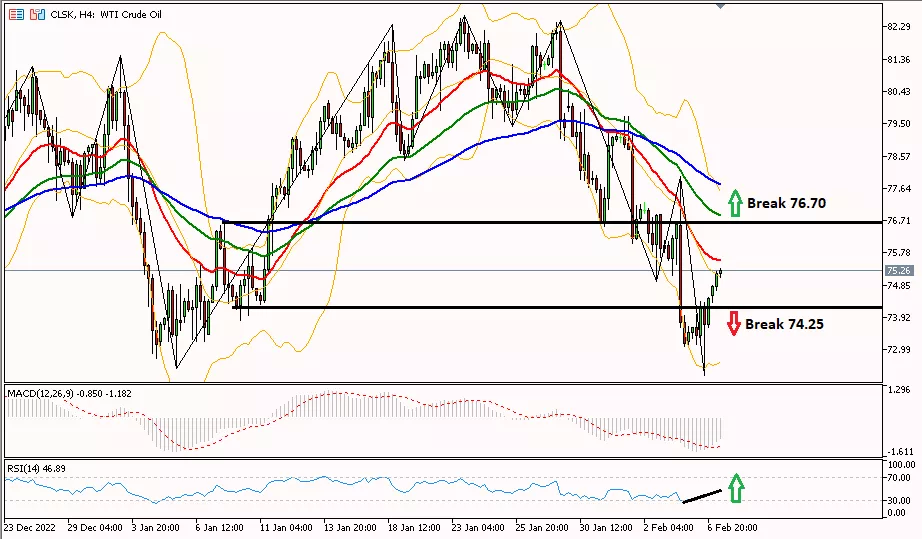
Daily Technical Analysis for oil prices in the 4-hour period is trying to rebound which is marked by the RSI indicator which is already in the oversold area. To change the bias to bullish it is necessary to break the level of 76.70 to test the resistance of 77.49. However, to continue the downtrend, it is necessary to break through the support at 74.25, and towards the next support at 72.99.
|
PREVIOUS RANGE |
||||||
|
OPEN |
HIGH |
LOW |
CLOSE |
PREV.CLOSE |
CHANGE |
%CHANGE |
|
73.22 |
74.49 |
72.24 |
74.48 |
73.17 |
1.31 |
1.79% |
|
DAILY PIVOT POINT |
||||||
|
R3 |
R2 |
R1 |
PIVOT |
S1 |
S2 |
S3 |
|
77.49 |
75.99 |
75.24 |
73.74 |
72.99 |
71.49 |
70.74 |
Well, that's the explanation of "Technical Daily Analysis: February 7, 2023 – US Dollar Corrects". Also read our other articles, such as an explanation of how to buy cryptocurrencies, only in the GIC Journal. Don't forget to practice your trading skills by getting the Scalping Ebook and following Live Trading on NFP Live Trading. Make sure, download GIC Mobile Apps on the Google Play Store.


