 Last:
Last: 
The following is a technical daily analysis, February 22, 2023. The data and analysis contained in this newsletter can be used on a wide scale for your trading. However, it is important to note that GICTrade and its data providers are not responsible for your trading results.
So, it's your own responsibility. Before knowing today's technical analysis, immediately register yourself to take part in the GIC Gebyar Prize and get the main prize, namely Mobile Mitshubshi Expander or Vacation Package to Labuan Bajo for 4 days and 3 nights.
In the following, we will inform you about the forecast of price movements in Forex and Commodities which is equipped with the calculation of Pivot points, Resistance and Support levels.
EURUSD
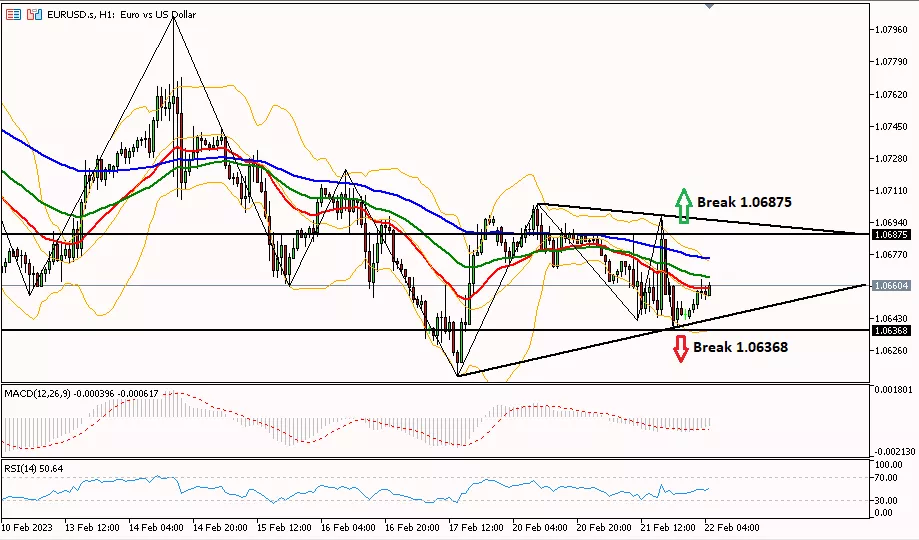
Daily Technical Analysis EUR/USD on the 1-hour period tried to rebound testing the resistance area at 1.06875. If it can be crossed, then the bullish bias will continue until the resistance level of 1.07270. Meanwhile, for further decline, the EUR/USD pair must first pass the support level of 1.06368, heading to the next support at 1.06050.
|
PREVIOUS RANGE |
||||||
|
OPEN |
HIGH |
LOW |
CLOSE |
PREV.CLOSE |
CHANGE |
%CHANGE |
|
1.06841 |
1.06976 |
1.06368 |
1.06452 |
1.06841 |
-0.00389 |
-0.37% |
|
DAILY PIVOT POINT |
||||||
|
R3 |
R2 |
R1 |
PIVOT |
S1 |
S2 |
S3 |
|
1.07560 |
1.07270 |
1.06950 |
1.06660 |
1.06340 |
1.06050 |
1.05740 |
GBPUSD
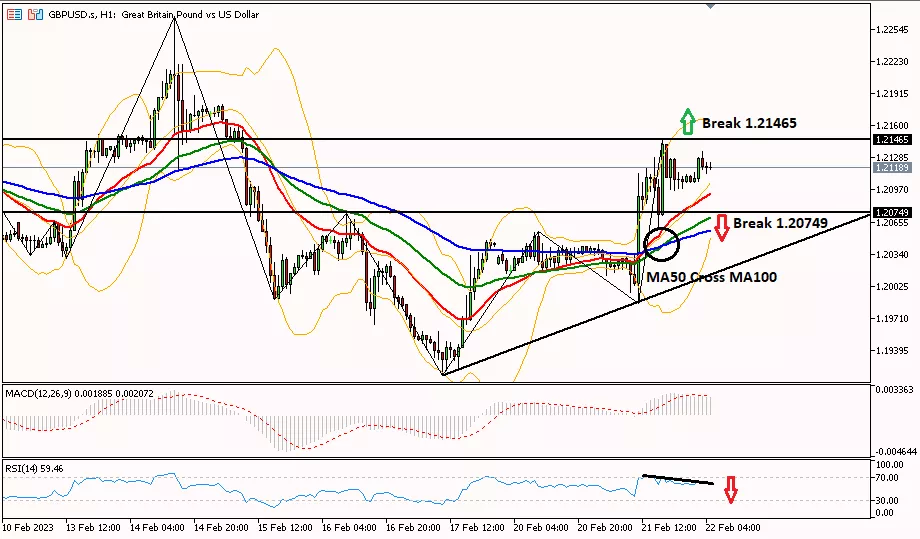
GBP/USD on the 1-hour period moved upwards trying to break through the resistance level of 1.21465 to test the resistance of 1.22310. The bullish trend is confirmed with the MA50 line which has crossed the MA100 line. Meanwhile, to change the bias to bearish, GBP/USD needs to break the support area at 1.20749 to head to the next support at 1.19930.
|
PREVIOUS RANGE |
||||||
|
OPEN |
HIGH |
LOW |
CLOSE |
PREV.CLOSE |
CHANGE |
%CHANGE |
|
1.20391 |
1.21469 |
1.19855 |
1.21104 |
1.20391 |
0.00713 |
0.59% |
|
DAILY PIVOT POINT |
||||||
|
R3 |
R2 |
R1 |
PIVOT |
S1 |
S2 |
S3 |
|
1.23160 |
1.22310 |
1.21550 |
1.20700 |
1.19930 |
1.19090 |
1.18320 |
AUDUSD
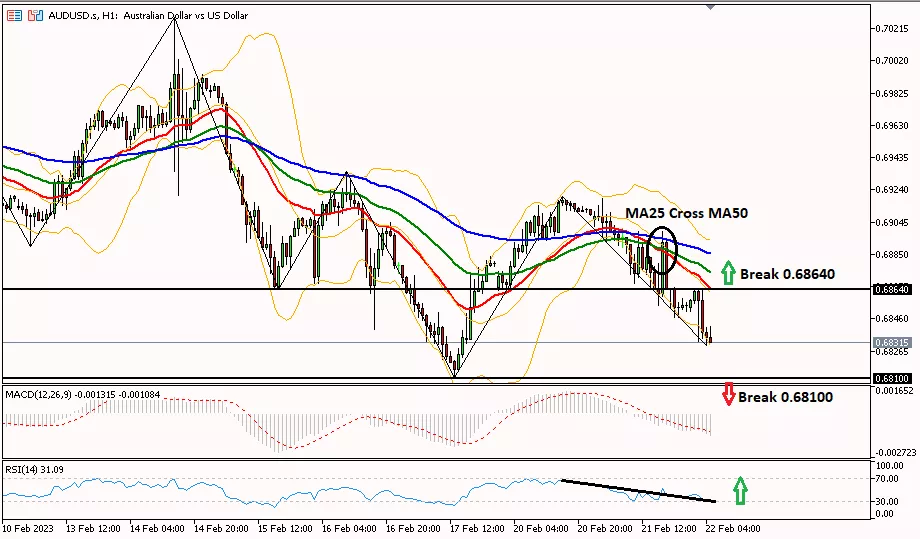
AUD/USD on the 1-hour period is in a consolidation phase towards the support level at 0.68100. The decline in the aussie is indicated by the MA25 line which has crossed the MA50 line from above. However, the decline will be limited once the RSI line is below the 30 level which is an oversold area, so the aussie has a chance to rebound to test the resistance level at 0.68640.
|
PREVIOUS RANGE |
||||||
|
OPEN |
HIGH |
LOW |
CLOSE |
PREV.CLOSE |
CHANGE |
%CHANGE |
|
0.69063 |
0.69190 |
0.68467 |
0.68543 |
0.69089 |
-0.00546 |
-0.80% |
|
DAILY PIVOT POINT |
||||||
|
R3 |
R2 |
R1 |
PIVOT |
S1 |
S2 |
S3 |
|
0.69900 |
0.69540 |
0.69170 |
0.68820 |
0.68450 |
0.68100 |
0.67730 |
USDCHF

The USD/CHF pair on the 1-hour period has the potential to move down, trying to break through the 0.92396 support level towards the next support in the 0.91950 area. The decline in USD/CHF was also confirmed by the RSI indicator moving downwards testing the 30 RSI level. Meanwhile, to turn the bias into bullish, USD/CHF needs to break 0.92818 first, to the next resistance level at 0.93400.
|
PREVIOUS RANGE |
||||||
|
OPEN |
HIGH |
LOW |
CLOSE |
PREV.CLOSE |
CHANGE |
%CHANGE |
|
0.92295 |
0.92818 |
0.92240 |
0.92770 |
0.92318 |
0.00452 |
0.49% |
|
DAILY PIVOT POINT |
||||||
|
R3 |
R2 |
R1 |
PIVOT |
S1 |
S2 |
S3 |
|
0.93400 |
0.93110 |
0.92820 |
0.92530 |
0.92240 |
0.91950 |
0.91660 |
USDJPY
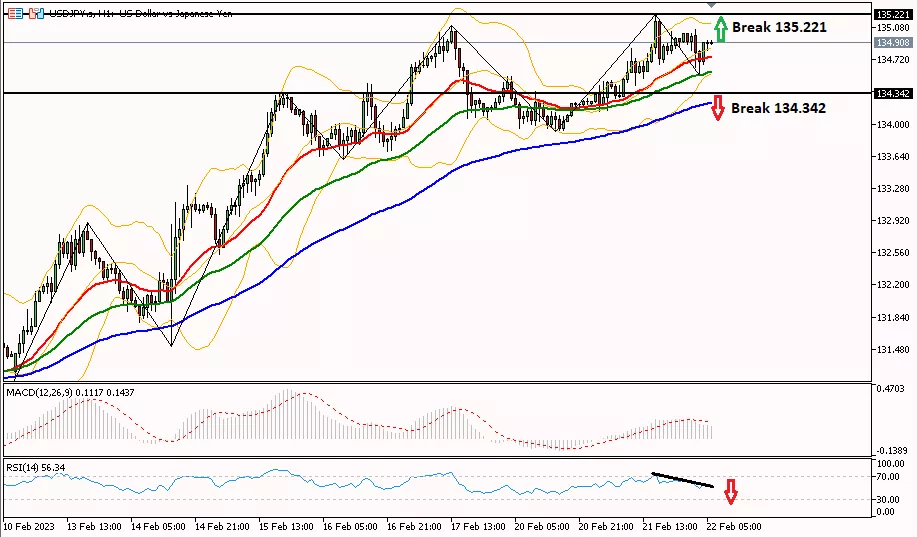
Daily Technical Analysis USD/JPY on the 1-hour period is still in an uptrend. For further bulls, it is necessary to break the resistance of 135,221 first. Meanwhile, to change the bias to bearish, USD/JPY needs to pass the support level of 134,342, to test the next support at 134,080. The decline in USD/JPY is also indicated by the RSI indicator which is already in the overbought area and moving downwards.
|
PREVIOUS RANGE |
||||||
|
OPEN |
HIGH |
LOW |
CLOSE |
PREV.CLOSE |
CHANGE |
%CHANGE |
|
134.231 |
135.221 |
134.145 |
135.016 |
134.253 |
0.763 |
0.57% |
|
DAILY PIVOT POINT |
||||||
|
R3 |
R2 |
R1 |
PIVOT |
S1 |
S2 |
S3 |
|
136.230 |
135.730 |
135.160 |
134.650 |
134.080 |
133.570 |
133.000 |
XUL (LOCO LONDON GOLD)
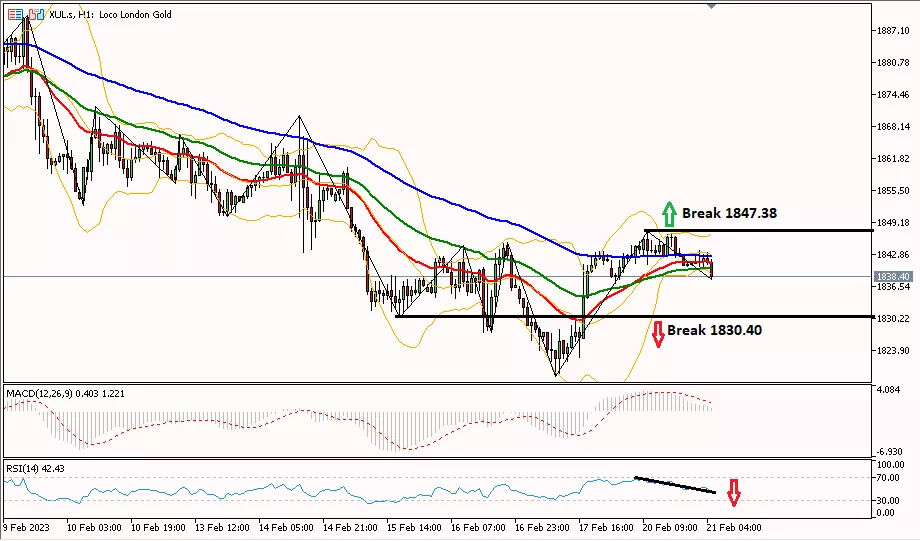
Daily Technical Analysis Gold prices in the 1-hour period are still in a downward trend as seen from the high price which is getting lower. A break of the 1830.15 area is needed to fall further towards the 1823.70 support. Meanwhile, to turn the bias into bullish, gold needs to pass through the resistance of 1843.70 to test the next resistance at 1850.90.
|
PREVIOUS RANGE |
||||||
|
OPEN |
HIGH |
LOW |
CLOSE |
PREV.CLOSE |
CHANGE |
%CHANGE |
|
1841.08 |
1843.70 |
1830.11 |
1834.28 |
1841.08 |
-6.80 |
-0.37% |
|
DAILY PIVOT POINT |
||||||
|
R3 |
R2 |
R1 |
PIVOT |
S1 |
S2 |
S3 |
|
1858.10 |
1850.90 |
1844.50 |
1837.30 |
1830.90 |
1823.70 |
1817.30 |
CLSK (OIL)
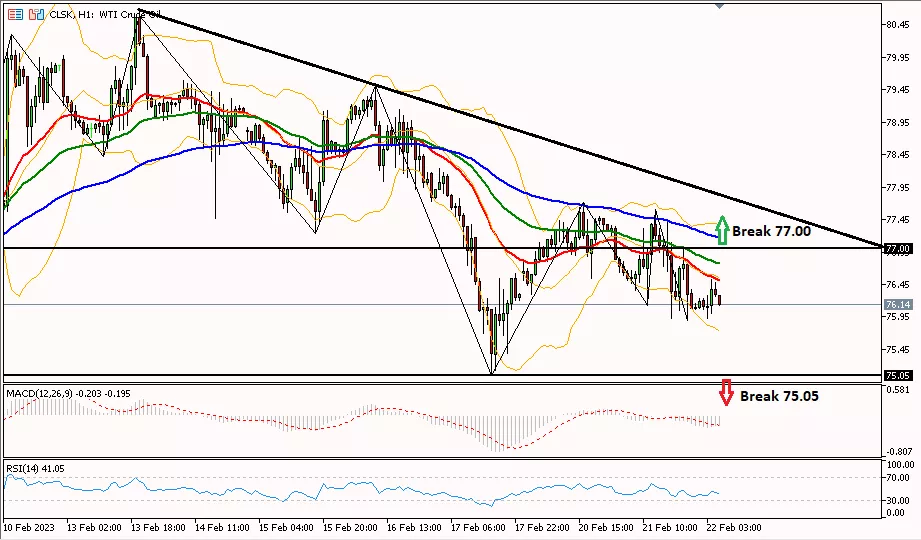
Oil prices in the 1-hour period are in a downtrend as seen from the chart which is still below the MA100 line. It needs a break of the 75.05 support to fall further. However, if the oil price is able to break through the resistance at 77.00, then the bias will be bullish towards the next resistance at 78.25.
|
PREVIOUS RANGE |
||||||
|
OPEN |
HIGH |
LOW |
CLOSE |
PREV.CLOSE |
CHANGE |
%CHANGE |
|
77.37 |
77.61 |
75.89 |
76.10 |
77.38 |
-1.28 |
-1.65% |
|
DAILY PIVOT POINT |
||||||
|
R3 |
R2 |
R1 |
PIVOT |
S1 |
S2 |
S3 |
|
78.89 |
78.25 |
77.17 |
76.53 |
75.45 |
74.81 |
73.73 |
So, that's the explanation of the "Daily Technical Analysis: February 22, 2023 – Sideways Greenback, Ahead of FOMC". Also read our other articles, such as an explanation of how to buy cryptocurrencies, only in the GIC Journal. Don't forget to practice your trading skills by getting the Scalping Ebook and following Live Trading on NFP Live Trading. Make sure, download GIC Mobile Apps on the Google Play Store.


