 Last:
Last: 
The following is a technical daily analysis, February 20, 2023. The data and analysis contained in this newsletter can be used on a wide scale for your trading. However, it is important to note that GICTrade and its data providers are not responsible for your trading results.
So, it's your own responsibility. Before knowing today's technical analysis, immediately register yourself to take part in the GIC Gebyar Prize and get the main prize, namely Mobile Mitshubshi Expander or Vacation Package to Labuan Bajo for 4 days and 3 nights.
In the following, we will inform you about the forecast of price movements in Forex and Commodities which is equipped with the calculation of Pivot points, Resistance and Support levels.
EURUSD
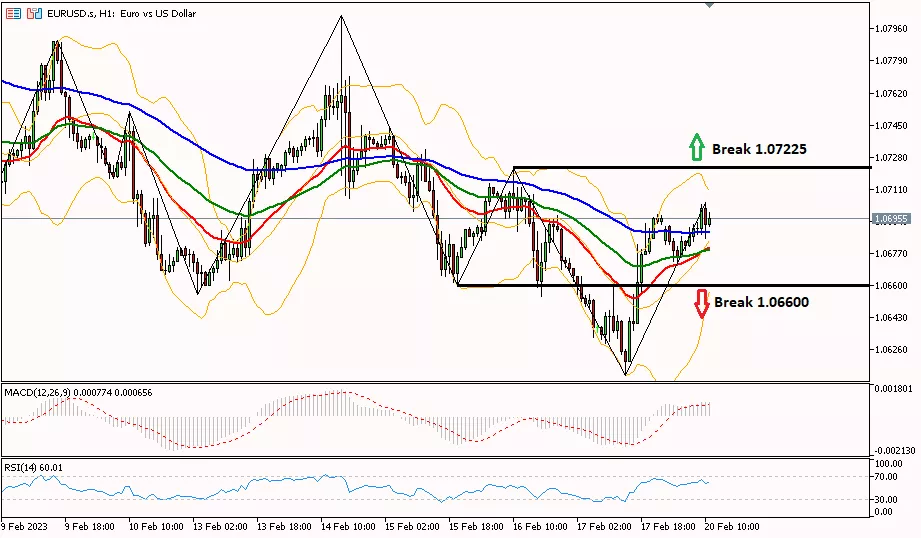
Daily Technical Analysis EUR/USD on the 1-hour period is trying to move upwards towards the area of 1.07225, which is indicated by the MA25 line touching the MA50 line. However, the increase is limited because the RSI indicator will be in the overbought area. Meanwhile, for the downtrend, EUR/USD needs to pass through the 1.06600 area first, testing the support of 1.05840.
|
PREVIOUS RANGE |
||||||
|
OPEN |
HIGH |
LOW |
CLOSE |
PREV.CLOSE |
CHANGE |
%CHANGE |
|
1.06717 |
1.06977 |
1.06122 |
1.06956 |
1.06720 |
0.00236 |
0.22% |
|
DAILY PIVOT POINT |
||||||
|
R3 |
R2 |
R1 |
PIVOT |
S1 |
S2 |
S3 |
|
1.08110 |
1.07550 |
1.07260 |
1.0669 |
1.06400 |
1.05840 |
1.05550 |
GBPUSD
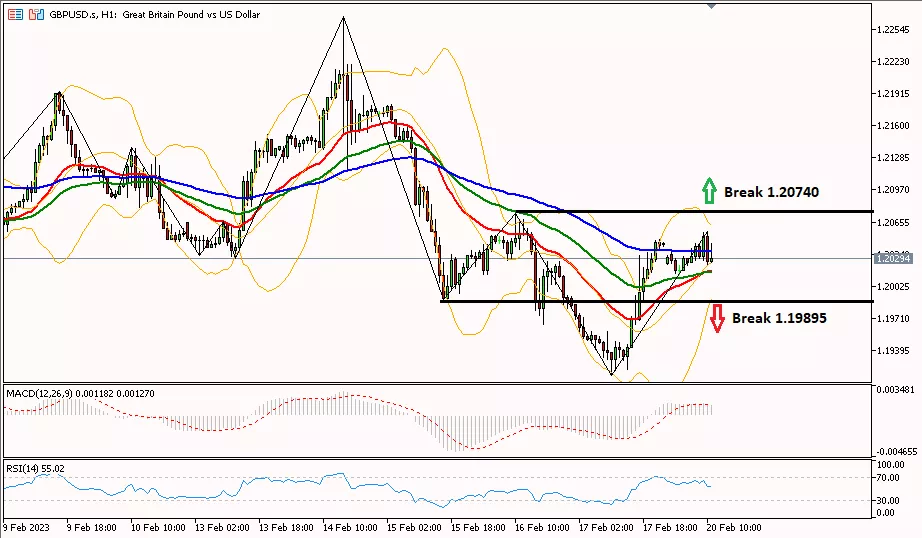
GBP/USD on the 1-hour period is trying to move up towards the 1.20740 area, which is indicated by the MA25 line touching the MA50 line. However, the increase is limited because the RSI indicator will be in the overbought area. Meanwhile, the downtrend of GBP/USD needs to pass through the 1.19895 area first, testing the support of 1.19510.
|
PREVIOUS RANGE |
||||||
|
OPEN |
HIGH |
LOW |
CLOSE |
PREV.CLOSE |
CHANGE |
%CHANGE |
|
1.19901 |
1.20486 |
1.19144 |
1.20449 |
1.19871 |
0.00578 |
0.48% |
|
DAILY PIVOT POINT |
||||||
|
R3 |
R2 |
R1 |
PIVOT |
S1 |
S2 |
S3 |
|
1.22200 |
1.21340 |
1.20860 |
1.20000 |
1.19510 |
1.18660 |
1.18170 |
AUDUSD
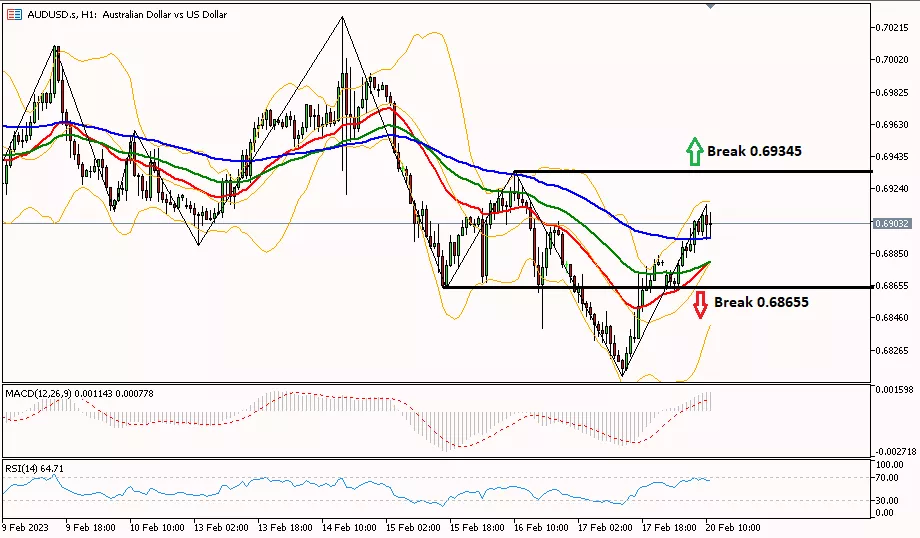
AUD/USD on the 1-hour period is trying to move up towards the area of 0.69345, which is indicated by the MA25 line touching the MA50 line. However, the increase is limited because the RSI indicator will be in the overbought area. Meanwhile, for the downtrend, AUD/USD needs to pass through the 0.68655 area first, testing the 0.68430 support.
|
PREVIOUS RANGE |
||||||
|
OPEN |
HIGH |
LOW |
CLOSE |
PREV.CLOSE |
CHANGE |
%CHANGE |
|
0.68782 |
0.68835 |
0.68109 |
0.68796 |
0.68784 |
0.00012 |
0.01% |
|
DAILY PIVOT POINT |
||||||
|
R3 |
R2 |
R1 |
PIVOT |
S1 |
S2 |
S3 |
|
0.69880 |
0.69360 |
0.69150 |
0.68630 |
0.68430 |
0.67900 |
0.67700 |
USDCHF
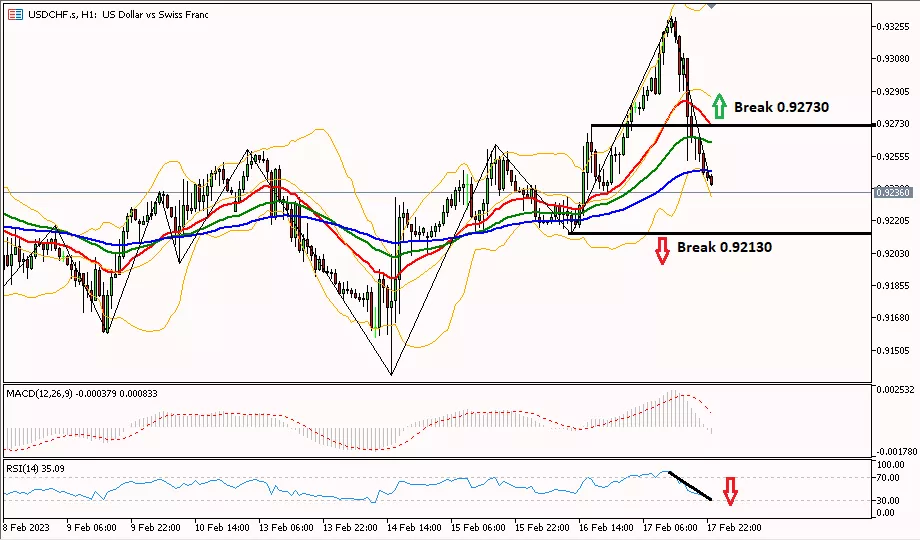
The USD/CHF pair on the 1-hour period tends to move down, trying to touch the support of 0.92130, if the break continues to the next support at 0.91750. However, the RSI indicator will be in the oversold area, then the decline will be limited. Meanwhile, to change the bias to bullish USD/CHF, it is necessary to break the 0.92730 area first.
|
PREVIOUS RANGE |
||||||
|
OPEN |
HIGH |
LOW |
CLOSE |
PREV.CLOSE |
CHANGE |
%CHANGE |
|
0.92565 |
0.93312 |
0.92394 |
0.92402 |
0.92565 |
-0.00163 |
-0.17% |
|
DAILY PIVOT POINT |
||||||
|
R3 |
R2 |
R1 |
PIVOT |
S1 |
S2 |
S3 |
|
0.93860 |
0.93590 |
0.92950 |
0.92670 |
0.92030 |
0.91750 |
0.91110 |
USDJPY
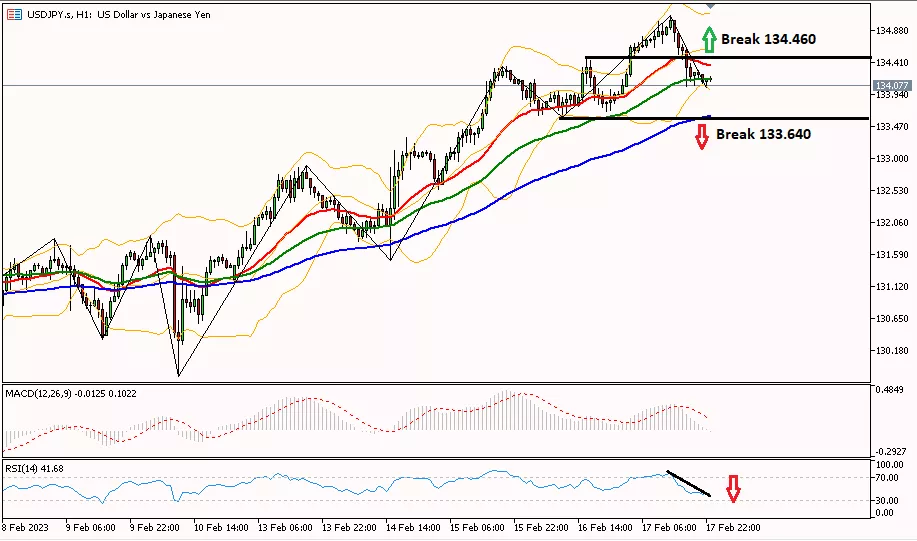
USD/JPY in the 1-hour period tends to move down, trying to touch the support of 133,640, if it breaks to continue to the next support at 133,100. However, the RSI indicator, which will be in the oversold area, will be limited. Meanwhile, to change the bias to bullish USD/JPY needs to break the 134,460 area first.
|
PREVIOUS RANGE |
||||||
|
OPEN |
HIGH |
LOW |
CLOSE |
PREV.CLOSE |
CHANGE |
%CHANGE |
|
133.938 |
135.102 |
133.921 |
134.158 |
133.938 |
0.220 |
0.16% |
|
DAILY PIVOT POINT |
||||||
|
R3 |
R2 |
R1 |
PIVOT |
S1 |
S2 |
S3 |
|
135.820 |
135.460 |
134.640 |
134.280 |
133.460 |
133.100 |
132.280 |
XUL (LOCO LONDON GOLD)
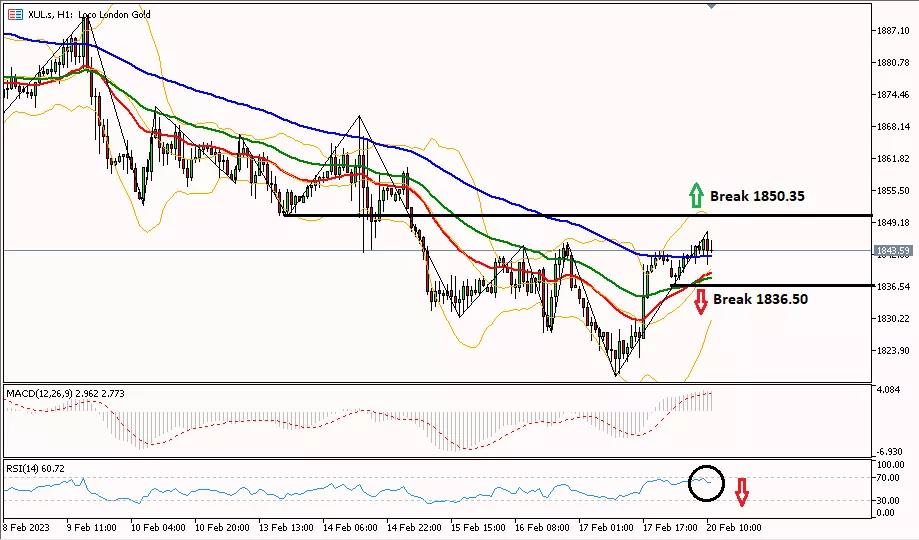
Gold prices in the 1-hour period are trying to move up towards the 1850.35 area, which is indicated by the MA25 line touching the MA50 line. However, the increase is limited because the RSI indicator will be in the overbought area. Meanwhile, gold's bearish trend will continue if the 1836.50 area can be crossed, until it tests the 1826.60 support.
|
PREVIOUS RANGE |
||||||
|
OPEN |
HIGH |
LOW |
CLOSE |
PREV.CLOSE |
CHANGE |
%CHANGE |
|
1835.98 |
1843.45 |
1818.77 |
1841.83 |
1836.76 |
5.07 |
0.28% |
|
DAILY PIVOT POINT |
||||||
|
R3 |
R2 |
R1 |
PIVOT |
S1 |
S2 |
S3 |
|
1875.90 |
1859.70 |
1851.20 |
1835.00 |
1826.60 |
1810.30 |
1801.90 |
CLSK (OIL)
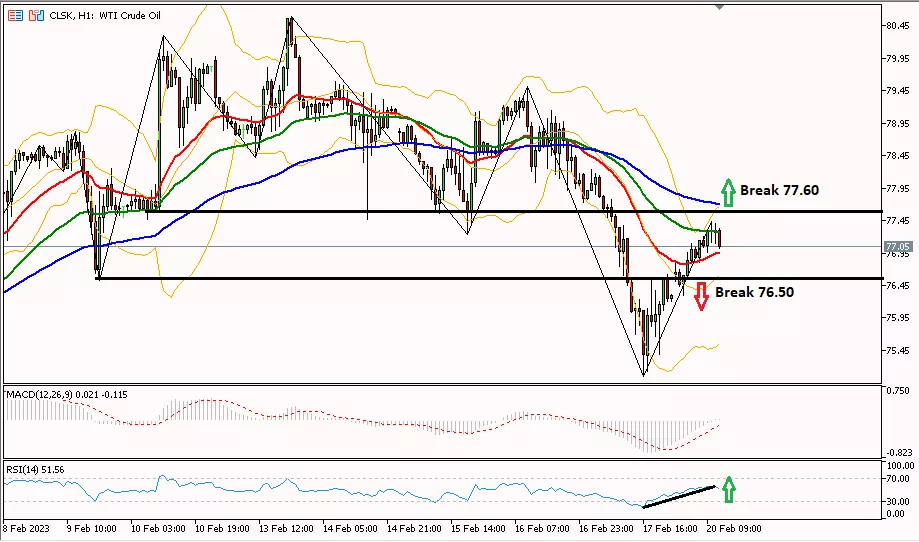
Oil prices in the 1-hour period tried to move up towards the 77.60 area, however, the increase was limited due to the RSI indicator which will be in the overbought area. Meanwhile, the oil bearish trend will continue if the 76.50 area can be crossed, until it tests the 74.81 support.
|
PREVIOUS RANGE |
||||||
|
OPEN |
HIGH |
LOW |
CLOSE |
PREV.CLOSE |
CHANGE |
%CHANGE |
|
78.16 |
78.23 |
75.05 |
76.29 |
78.07 |
-1.78 |
-2.28% |
|
DAILY PIVOT POINT |
||||||
|
R3 |
R2 |
R1 |
PIVOT |
S1 |
S2 |
S3 |
|
81.17 |
79.70 |
77.99 |
76.52 |
74.81 |
73.34 |
71.63 |
So, that's the explanation of "Technical Daily Analysis: February 20, 2023 – Minimal Data, US Dollar Sideways". Also read our other articles, such as an explanation of how to buy cryptocurrencies, only in the GIC Journal. Don't forget to practice your trading skills by getting the Scalping Ebook and following Live Trading on NFP Live Trading. Make sure, download GIC Mobile Apps on the Google Play Store.


