 Last:
Last: 
The following is a technical daily analysis, February 2, 2023. The data and analysis contained in this newsletter can be used on a wide scale for your trading. However, it is important to note that GICTrade and its data providers are not responsible for your trading results.
So, it's your own responsibility. Before knowing today's technical analysis, immediately register yourself to take part in the GIC Gebyar Prize and get the main prize, namely Mobile Mitshubshi Expander or Vacation Package to Labuan Bajo for 4 days and 3 nights.
In the following, we will inform you about the forecast of price movements in Forex and Commodities which is equipped with the calculation of Pivot points, Resistance and Support levels.
EURUSD

EUR/USD on the 1-hour period has a chance to correct after the RSI indicator is already in the overbought area. A minor break of support at 1.09845 is needed for further decline towards the 1.09140 target. However, the MA50 intersecting with the MA100 indicates an uptrend testing the resistance of 1.10750.
|
PREVIOUS RANGE |
||||||
|
OPEN |
HIGH |
LOW |
CLOSE |
PREV.CLOSE |
CHANGE |
%CHANGE |
|
1.08612 |
1.10001 |
1.08516 |
1.09893 |
1.08612 |
0.01281 |
1.18% |
|
DAILY PIVOT POINT |
||||||
|
R3 |
R2 |
R1 |
PIVOT |
S1 |
S2 |
S3 |
|
1.11490 |
1.10750 |
1.10000 |
1.09260 |
1.08520 |
1.07780 |
1.07030 |
GBPUSD
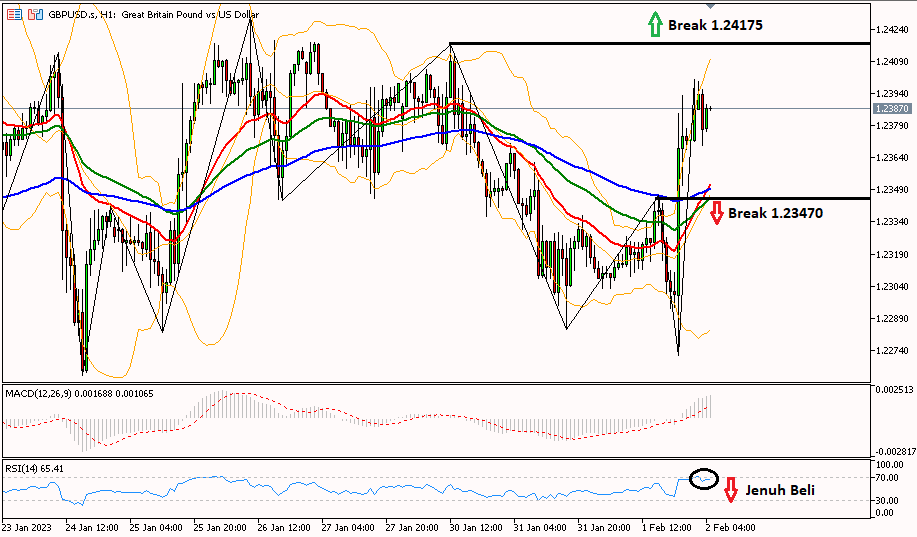
Daily Technical Analysis for GBP/USD entered a consolidation phase after the 1-hour RSI touched the overbought area, trying to touch the support of 1.23470 which was previously a resistance level. While a further uptrend needs to break through the 1.24175 resistance first, to test the R2 area at 1.24590.
|
PREVIOUS RANGE |
||||||
|
OPEN |
HIGH |
LOW |
CLOSE |
PREV.CLOSE |
CHANGE |
%CHANGE |
|
1.23174 |
1.23930 |
1.22716 |
1.23719 |
1.23174 |
0.00545 |
0.44% |
|
DAILY PIVOT POINT |
||||||
|
R3 |
R2 |
R1 |
PIVOT |
S1 |
S2 |
S3 |
|
1.25260 |
1.24590 |
1.24040 |
1.23380 |
1.22830 |
1.22170 |
1.21620 |
AUDUSD

AUD/USD in the 1-hour period tends to move a correction, which is indicated by the RSI which is already in the overbought area. If the aussie is able to break through the support of 0.71220, then the decline continues with the target of 0.70915. Meanwhile, to continue the rally with the MA50 crossing the MA100 line, the AUD/USD pair is trying to test the next resistance at 0.72000.
|
PREVIOUS RANGE |
||||||
|
OPEN |
HIGH |
LOW |
CLOSE |
PREV.CLOSE |
CHANGE |
%CHANGE |
|
0.70529 |
0.71439 |
0.70358 |
0.71350 |
0.70529 |
0.00821 |
1.16% |
|
DAILY PIVOT POINT |
||||||
|
R3 |
R2 |
R1 |
PIVOT |
S1 |
S2 |
S3 |
|
0.72560 |
0.72000 |
0.71480 |
0.70920 |
0.70400 |
0.69840 |
0.69320 |
USDCHF

The USD/CHF pair on the 1-hour period tried to rebound after touching the oversold area of the RSI indicator. To change the bias to bullish, it is necessary to break the 0.90825 area first with a target at 0.91500. However, if the Swiss franc is able to break through the second daily support of S2 at 0.90100, then the decline will continue until the strongest support of S3 at 0.89510.
|
PREVIOUS RANGE |
||||||
|
OPEN |
HIGH |
LOW |
CLOSE |
PREV.CLOSE |
CHANGE |
%CHANGE |
|
0.91582 |
0.91820 |
0.90691 |
0.90838 |
0.91601 |
-0.00763 |
-0.83% |
|
DAILY PIVOT POINT |
||||||
|
R3 |
R2 |
R1 |
PIVOT |
S1 |
S2 |
S3 |
|
0.92900 |
0.92360 |
0.91770 |
0.91230 |
0.90640 |
0.90100 |
0.89510 |
USDJPY
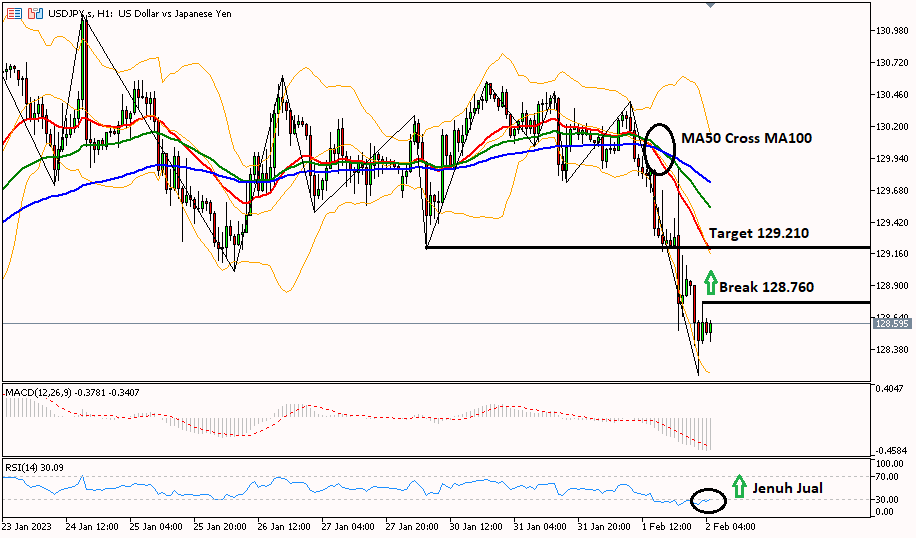
Daily Technical Analysis for the USD/JPY pair is trying to move a rebound as indicated by the RSI indicator in the 1-hour period which is already in the oversold area. A break of 128,760 is needed to change the bias to bullish with a target at 129,210. While the MA50 line crossing the MA100 line signals a downtrend, testing the support of 127,620.
|
PREVIOUS RANGE |
||||||
|
OPEN |
HIGH |
LOW |
CLOSE |
PREV.CLOSE |
CHANGE |
%CHANGE |
|
130.083 |
130.405 |
128.534 |
128.954 |
130.094 |
-1.140 |
-0.88% |
|
DAILY PIVOT POINT |
||||||
|
R3 |
R2 |
R1 |
PIVOT |
S1 |
S2 |
S3 |
|
132.320 |
131.360 |
130.450 |
129.490 |
128.580 |
127.620 |
126.700 |
XUL (LOCO LONDON GOLD)

Gold prices in an uptrend tested the second day resistance of R2 at 1972.10, which can be seen from the MA50 line intersecting with the MA100 line from below in the 1-hour period. However, gold has the potential to correct amid the RSI indicator which is already in the overbought area. It needs to break the 1948.85 support first to fall further towards the 1934.80 target.
|
PREVIOUS RANGE |
||||||
|
OPEN |
HIGH |
LOW |
CLOSE |
PREV.CLOSE |
CHANGE |
%CHANGE |
|
1928.11 |
1954.36 |
1920.45 |
1949.90 |
1928.28 |
21.62 |
1.12% |
|
DAILY PIVOT POINT |
||||||
|
R3 |
R2 |
R1 |
PIVOT |
S1 |
S2 |
S3 |
|
1989.90 |
1972.10 |
1956.00 |
1938.20 |
1922.00 |
1904.30 |
1888.10 |
CLSK (OIL)

Daily Technical Analysis for oil prices is trying to rebound, where the 1-hour RSI indicator is already in the sell area. To turn the bias into bullish, it is necessary to break the 77.75 area towards the target at 78.50. However, if oil prices are able to break through the 76.05 support, the downtrend will continue to test the S1 daily support at 75.28.
|
PREVIOUS RANGE |
||||||
|
OPEN |
HIGH |
LOW |
CLOSE |
PREV.CLOSE |
CHANGE |
%CHANGE |
|
79.04 |
79.70 |
76.05 |
76.73 |
79.11 |
-2.38 |
-3.01% |
|
DAILY PIVOT POINT |
||||||
|
R3 |
R2 |
R1 |
PIVOT |
S1 |
S2 |
S3 |
|
82.58 |
81.14 |
78.93 |
77.49 |
75.28 |
73.84 |
71.63 |
So, that's the explanation of "Technical Daily Analysis: February 2, 2023 – The Fed Dovish, US Dollar depreciates". Also read our other articles, such as an explanation of how to buy cryptocurrencies, only in the GIC Journal. Don't forget to practice your trading skills by getting the Scalping Ebook and following Live Trading on NFP Live Trading. Make sure, download GIC Mobile Apps on the Google Play Store.


