 Last:
Last: 
The following is a daily technical analysis, February 17, 2023. The data and analysis contained in this newsletter can be used on a wide scale for your trading. However, it is important to note that GICTrade and its data providers are not responsible for your trading results.
So, it's your own responsibility. Before knowing today's technical analysis, immediately register yourself to take part in the GIC Gebyar Prize and get the main prize, namely Mobile Mitshubshi Expander or Vacation Package to Labuan Bajo for 4 days and 3 nights.
In the following, we will inform you about the forecast of price movements in Forex and Commodities which is equipped with the calculation of Pivot points, Resistance and Support levels.
EURUSD
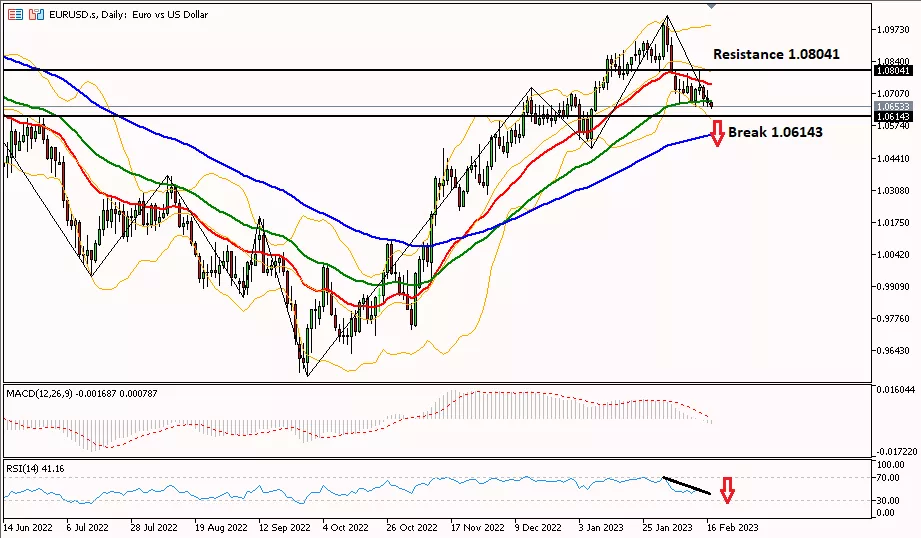
EUR/USD in the daily period tends to move downwards trying to break through the support level of 1.06143, to test the strongest daily support or S3 at 1.05770. Meanwhile, to turn the bias into a bullish one, it is necessary to pass the resistance of 1.07120 first.
|
PREVIOUS RANGE |
||||||
|
OPEN |
HIGH |
LOW |
CLOSE |
PREV.CLOSE |
CHANGE |
%CHANGE |
|
1.06861 |
1.07217 |
1.06539 |
1.06720 |
1.06861 |
-0.00141 |
-0.13% |
|
DAILY PIVOT POINT |
||||||
|
R3 |
R2 |
R1 |
PIVOT |
S1 |
S2 |
S3 |
|
1.07800 |
1.07510 |
1.07120 |
1.06830 |
1.06440 |
1.06150 |
1.05770 |
GBPUSD
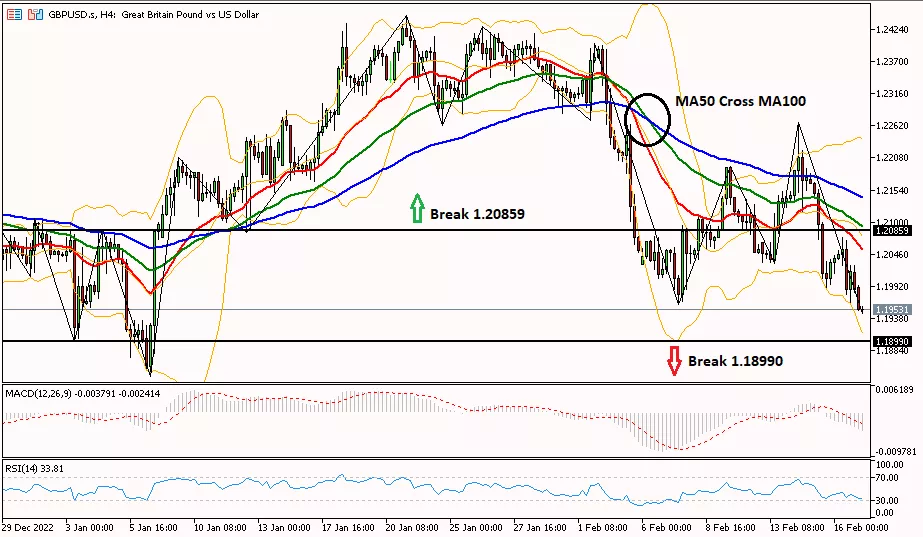
GBP/USD in the 4-hour period moved down which is visible from the MA50 line which has crossed the MA100 line from above. To resume the decline, it is necessary to pass through the 1.18990 support testing the strongest daily support or S3 at 1.18460. Meanwhile, to turn the bias into bullish, it is necessary to pass the resistance level of 1.20859 first.
|
PREVIOUS RANGE |
||||||
|
OPEN |
HIGH |
LOW |
CLOSE |
PREV.CLOSE |
CHANGE |
%CHANGE |
|
1.20319 |
1.20735 |
1.19645 |
1.19871 |
1.20319 |
-0.00448 |
-0.37% |
|
DAILY PIVOT POINT |
||||||
|
R3 |
R2 |
R1 |
PIVOT |
S1 |
S2 |
S3 |
|
1.21730 |
1.21230 |
1.20640 |
1.20140 |
1.19550 |
1.19050 |
1.18460 |
AUDUSD
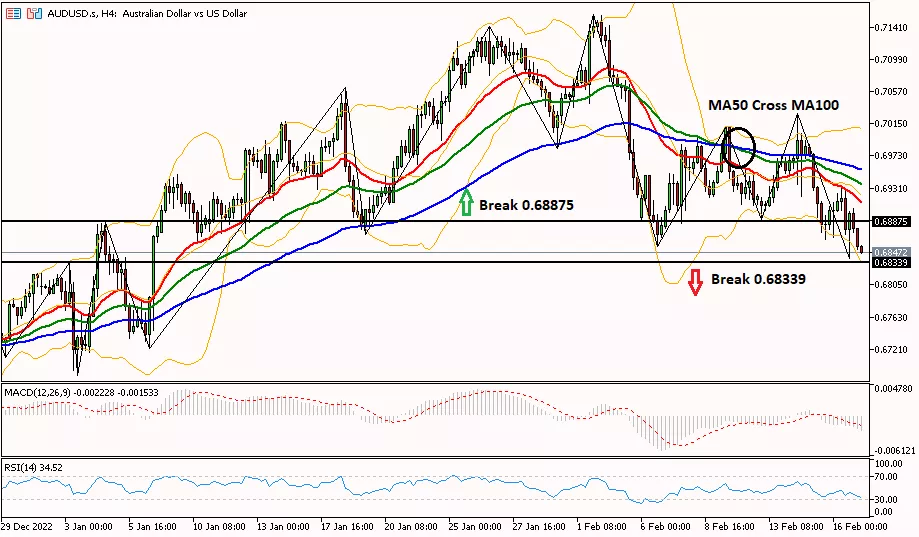
Daily Technical Analysis for the AUD/USD pair in the 4-hour period tends to move downwards as seen from the MA50 line which has crossed the MA100 line from above. To resume the decline, it is necessary to pass through the 0.68339 support testing the strongest daily support or S3 at 0.67480. Meanwhile, to turn the bias into bullish, it is necessary to pass the resistance level of 0.68875 first.
|
PREVIOUS RANGE |
||||||
|
OPEN |
HIGH |
LOW |
CLOSE |
PREV.CLOSE |
CHANGE |
%CHANGE |
|
0.69013 |
0.69350 |
0.68396 |
0.68784 |
0.69022 |
-0.00238 |
-0.35% |
|
DAILY PIVOT POINT |
||||||
|
R3 |
R2 |
R1 |
PIVOT |
S1 |
S2 |
S3 |
|
0.70340 |
0.69840 |
0.69380 |
0.68890 |
0.68430 |
0.67940 |
0.67480 |
USDCHF
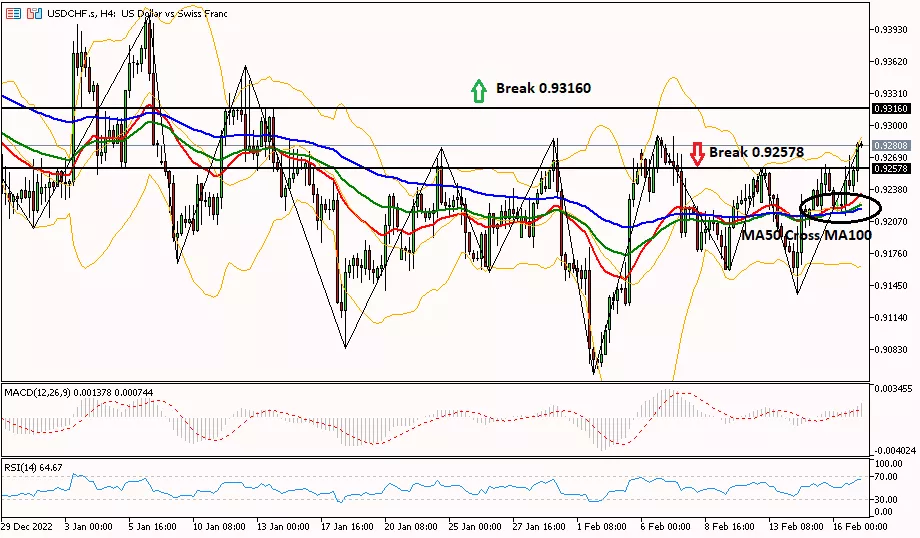
The USD/CHF pair in the 4-hour period tends to move upwards as seen from the MA50 line which has crossed the MA100 line from below. To resume the rally, it is necessary to cross the resistance of 0.93160 testing the strongest daily resistance or R3 at 0.93330. Meanwhile, to change the bias to bearish, it is necessary to pass the support level of 0.92578 first.
|
PREVIOUS RANGE |
||||||
|
OPEN |
HIGH |
LOW |
CLOSE |
PREV.CLOSE |
CHANGE |
%CHANGE |
|
0.92366 |
0.92711 |
0.92132 |
0.92565 |
0.92365 |
0.00200 |
0.22% |
|
DAILY PIVOT POINT |
||||||
|
R3 |
R2 |
R1 |
PIVOT |
S1 |
S2 |
S3 |
|
0.93330 |
0.93020 |
0.92750 |
0.92440 |
0.92170 |
0.91860 |
0.91590 |
USDJPY
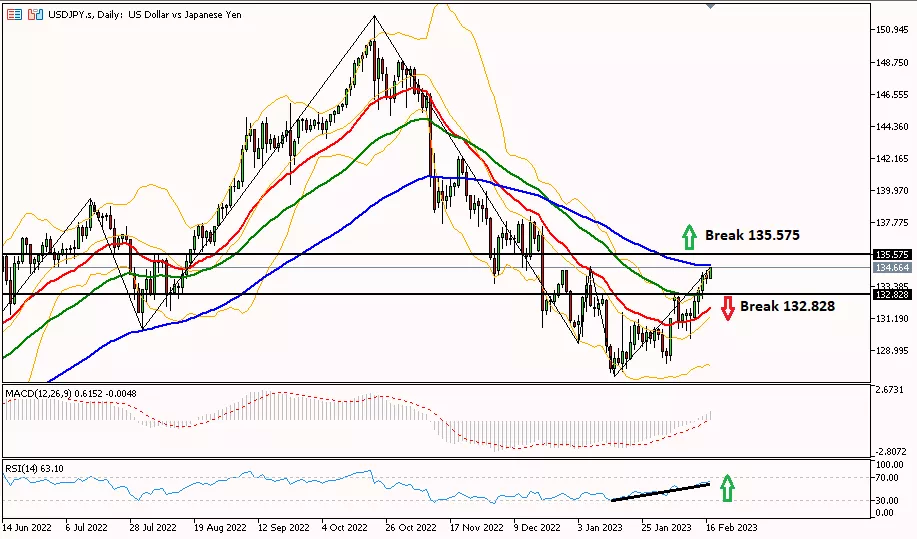
USD/JPY in the daily period tends to move upwards as seen from the RSI indicator moving upwards. To continue the rise, it is necessary to cross the resistance of 135,575. Meanwhile, to change the bias to bearish, it is necessary to pass the support level of 132,828 first.
|
PREVIOUS RANGE |
||||||
|
OPEN |
HIGH |
LOW |
CLOSE |
PREV.CLOSE |
CHANGE |
%CHANGE |
|
134.142 |
134.457 |
133.599 |
133.938 |
134.161 |
-0.223 |
-0.16% |
|
DAILY PIVOT POINT |
||||||
|
R3 |
R2 |
R1 |
PIVOT |
S1 |
S2 |
S3 |
|
135.320 |
134.890 |
134.460 |
134.030 |
133.600 |
133.170 |
132.750 |
XUL (LOCO LONDON GOLD)
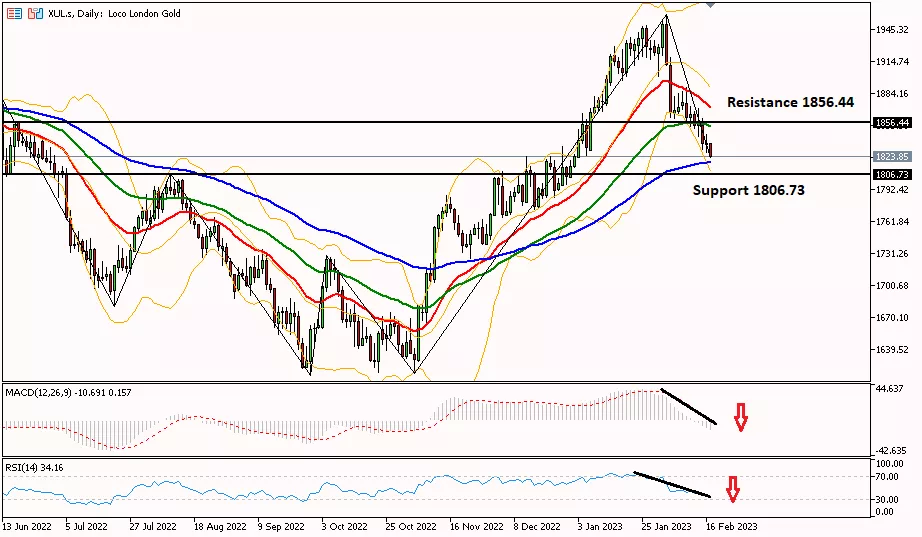
Gold prices in the daily period have the potential to fall further, as indicated by the MACD indicator which is in negative territory and the RSI which is moving down. Gold is trying to touch the support level at 1806.73.
|
PREVIOUS RANGE |
||||||
|
OPEN |
HIGH |
LOW |
CLOSE |
PREV.CLOSE |
CHANGE |
%CHANGE |
|
1835.54 |
1845.21 |
1827.48 |
1836.76 |
1836.63 |
0.13 |
0.01% |
|
DAILY PIVOT POINT |
||||||
|
R3 |
R2 |
R1 |
PIVOT |
S1 |
S2 |
S3 |
|
1862.70 |
1853.90 |
1844.90 |
1836.20 |
1827.20 |
1818.50 |
1809.50 |
CLSK (OIL)
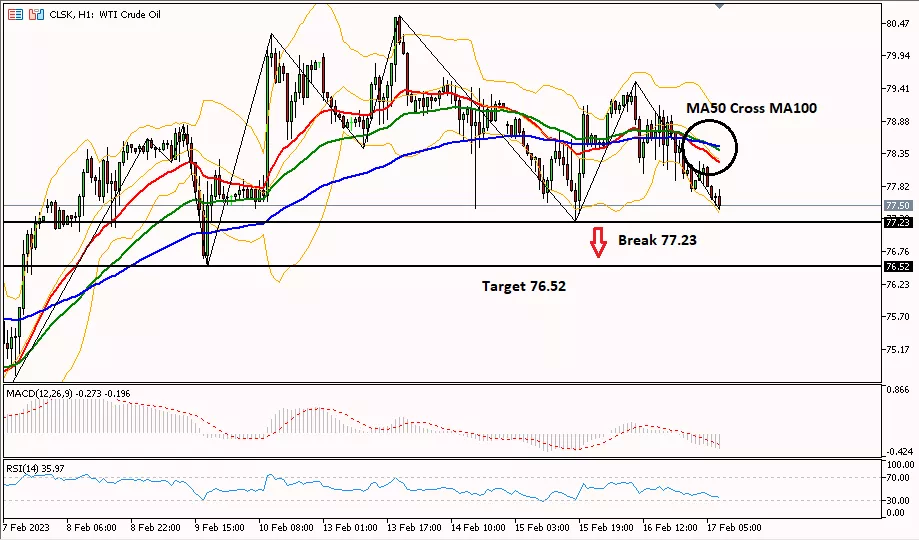
Daily Technical Analysis for oil prices in the 1-hour period is in a consolidation phase, to fall further it is necessary to break the 77.23 area with a target to the support level of 76.52. The decline in oil prices is also confirmed by the MA50 line which has crossed the MA100 line from above.
|
PREVIOUS RANGE |
||||||
|
OPEN |
HIGH |
LOW |
CLOSE |
PREV.CLOSE |
CHANGE |
%CHANGE |
|
78.52 |
79.52 |
77.91 |
78.07 |
78.50 |
-0.43 |
-0.55% |
|
DAILY PIVOT POINT |
||||||
|
R3 |
R2 |
R1 |
PIVOT |
S1 |
S2 |
S3 |
|
80.70 |
80.11 |
79.09 |
78.50 |
77.48 |
76.89 |
75.87 |
So, that's the explanation of "Technical Daily Analysis: February 17, 2023 – US Dollar Appreciates". Also read our other articles, such as an explanation of how to buy cryptocurrencies, only in the GIC Journal. Don't forget to practice your trading skills by getting the Scalping Ebook and following Live Trading on NFP Live Trading. Make sure, download GIC Mobile Apps on the Google Play Store.


