 Last:
Last: 
The following is a technical daily analysis, February 10, 2023. The data and analysis contained in this newsletter can be used on a wide scale for your trading. However, it is important to note that GICTrade and its data providers are not responsible for your trading results.
So, it's your own responsibility. Before knowing today's technical analysis, immediately register yourself to take part in the GIC Gebyar Prize and get the main prize, namely Mobile Mitshubshi Expander or Vacation Package to Labuan Bajo for 4 days and 3 nights.
In the following, we will inform you about the forecast of price movements in Forex and Commodities which is equipped with the calculation of Pivot points, Resistance and Support levels.
EURUSD
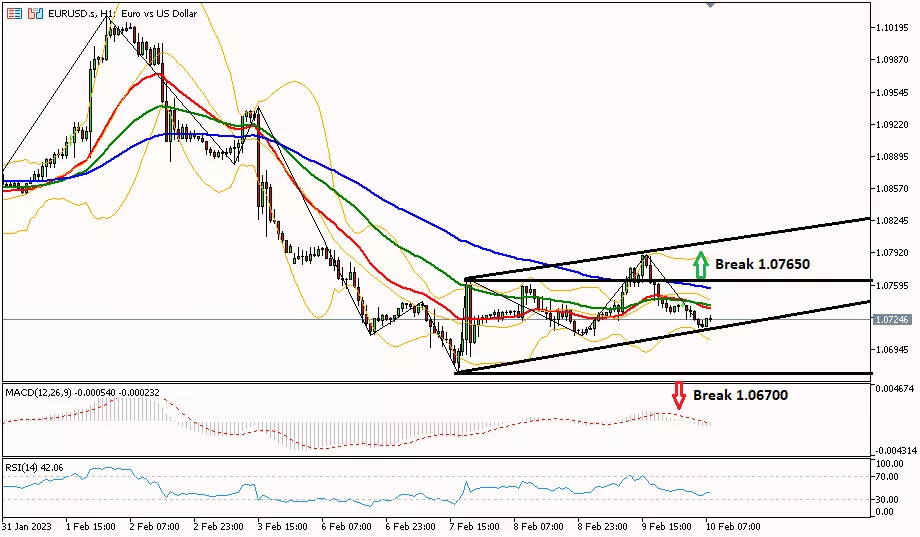
EUR/USD on the 1-hour period is in an uptrend pattern, with rising lows. It needs to break the 1.07650 area to rise further, to test resistance at 1.08180. However, the bias will turn bearish if the 1.06700 support can be crossed towards the strongest daily support or S3 at 1.06030.
|
PREVIOUS RANGE |
||||||
|
OPEN |
HIGH |
LOW |
CLOSE |
PREV.CLOSE |
CHANGE |
%CHANGE |
|
1.07114 |
1.07900 |
1.07086 |
1.07376 |
1.07133 |
0.00243 |
0.22% |
|
DAILY PIVOT POINT |
||||||
|
R3 |
R2 |
R1 |
PIVOT |
S1 |
S2 |
S3 |
|
1.08470 |
1.08180 |
1.07650 |
1.07370 |
1.06840 |
1.06560 |
1.06030 |
GBPUSD
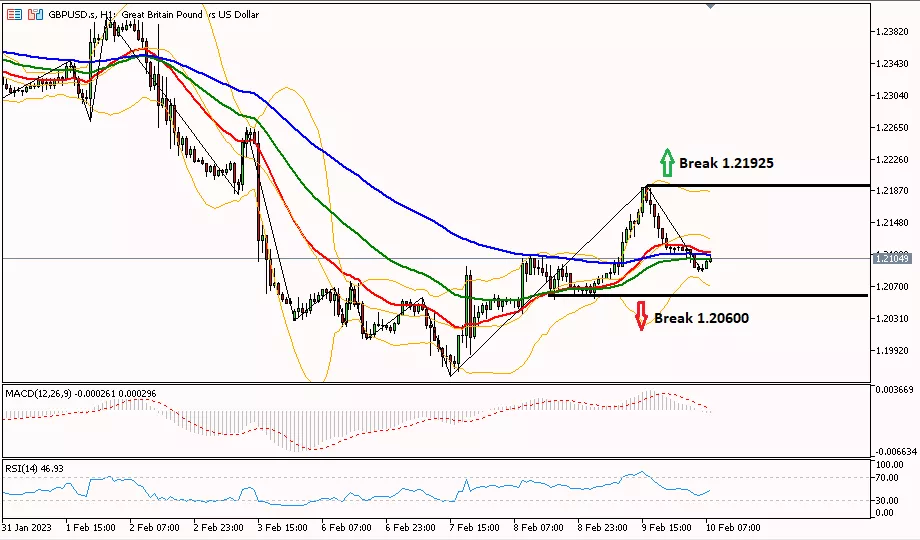
Daily Technical Analysis for the GBP/USD pair on the 1-hour period is still in a downtrend, in order to resume the bearish bias it is necessary to break the 1.20600 area first, trying to test the support of 1.19720. Meanwhile, to turn the bias to bullish GBP/USD needs to pass through the resistance of 1.21925 to the next resistance at 1.22460.
|
PREVIOUS RANGE |
||||||
|
OPEN |
HIGH |
LOW |
CLOSE |
PREV.CLOSE |
CHANGE |
%CHANGE |
|
1.20693 |
1.21932 |
1.20562 |
1.21173 |
1.20702 |
0.00471 |
0.39% |
|
DAILY PIVOT POINT |
||||||
|
R3 |
R2 |
R1 |
PIVOT |
S1 |
S2 |
S3 |
|
1.22990 |
1.22460 |
1.21620 |
1.21090 |
1.20250 |
1.19720 |
1.18880 |
AUDUSD
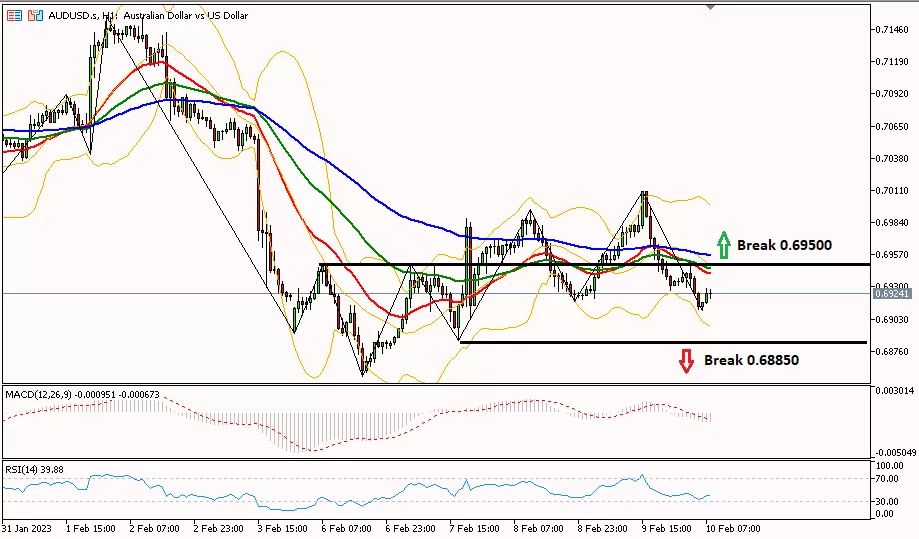
AUD/USD on the 1-hour period moves in a limited range, it needs to break one of the resistance and support levels to see the direction of the next trend. A break of 0.69500 is needed to continue the rise, until the next resistance at 0.70380. However, if it is able to break through the 0.68850 area, then the bias turns bearish, testing the support of 0.67930.
|
PREVIOUS RANGE |
||||||
|
OPEN |
HIGH |
LOW |
CLOSE |
PREV.CLOSE |
CHANGE |
%CHANGE |
|
0.69230 |
0.70105 |
0.69195 |
0.69350 |
0.69230 |
0.00120 |
0.17% |
|
DAILY PIVOT POINT |
||||||
|
R3 |
R2 |
R1 |
PIVOT |
S1 |
S2 |
S3 |
|
0.70660 |
0.70380 |
0.69750 |
0.69470 |
0.68840 |
0.68560 |
0.67930 |
USDCHF
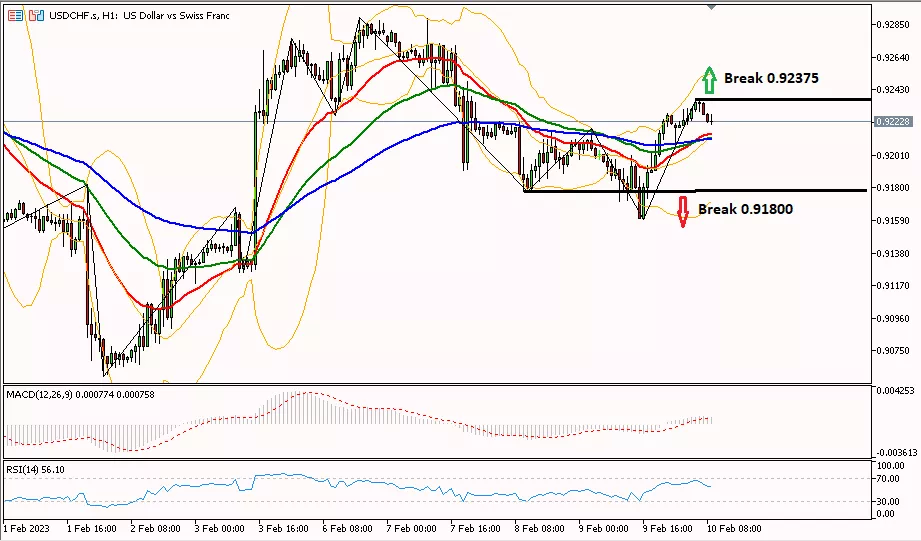
The USD/CHF pair on the 1-hour period was observed to be bearish, trying to test the 0.91800 support area testing the next support at 0.91360. However, if USD/CHF manages to break through the resistance of 0.92375 again, then the bullish bias will continue towards the resistance level of 0.92720.
|
PREVIOUS RANGE |
||||||
|
OPEN |
HIGH |
LOW |
CLOSE |
PREV.CLOSE |
CHANGE |
%CHANGE |
|
0.92077 |
0.92277 |
0.91597 |
0.92212 |
0.92083 |
0.00129 |
0.14% |
|
DAILY PIVOT POINT |
||||||
|
R3 |
R2 |
R1 |
PIVOT |
S1 |
S2 |
S3 |
|
0.93160 |
0.92720 |
0.92480 |
0.92040 |
0.91800 |
0.91360 |
0.91120 |
USDJPY
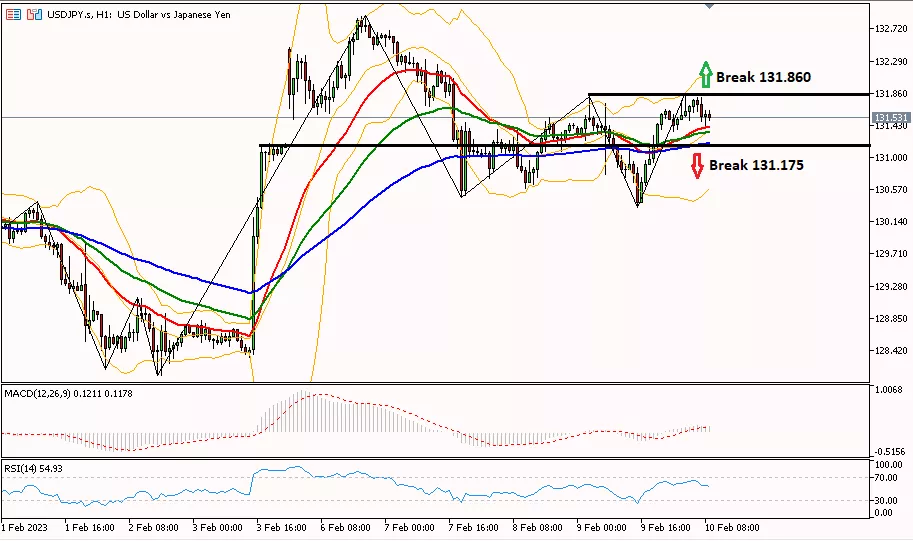
Daily Technical Analysis for the USD/JPY pair on a 1-hour period has a chance to fall. To fall further, it is necessary to break the 131,175 area to reach the support level at 130,700. However, if USD/JPY manages to break through the 131.860 area, the rally will continue until the 132.740 resistance area.
|
PREVIOUS RANGE |
||||||
|
OPEN |
HIGH |
LOW |
CLOSE |
PREV.CLOSE |
CHANGE |
%CHANGE |
|
131.386 |
131.820 |
130.336 |
131.511 |
131.434 |
0.077 |
0.06% |
|
DAILY PIVOT POINT |
||||||
|
R3 |
R2 |
R1 |
PIVOT |
S1 |
S2 |
S3 |
|
133.670 |
132.740 |
132.180 |
131.260 |
130.700 |
129.780 |
129.220 |
XUL (LOCO LONDON GOLD)
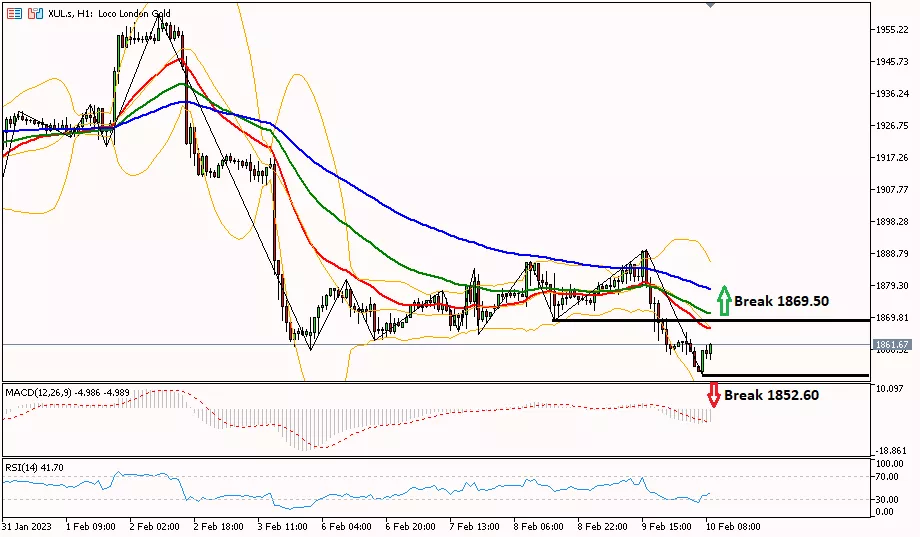
Gold prices are trying to rebound in the 1-hour period, needing to break the 1869.50 area to change the bias to bullish, to test the resistance level of 1883.60. Meanwhile, to fall further, gold prices need to cross the 1852.60 area again, trying to test the 1840.00 support.
|
PREVIOUS RANGE |
||||||
|
OPEN |
HIGH |
LOW |
CLOSE |
PREV.CLOSE |
CHANGE |
%CHANGE |
|
1874.71 |
1890.03 |
1858.80 |
1861.25 |
1875.41 |
-14.16 |
-0.76% |
|
DAILY PIVOT POINT |
||||||
|
R3 |
R2 |
R1 |
PIVOT |
S1 |
S2 |
S3 |
|
1914.80 |
1902.40 |
1883.60 |
1871.20 |
1852.40 |
1840.00 |
1821.10 |
CLSK (OIL)

Daily Technical Analysis for oil prices in the 1-hour period is in a sideways phase, to rise further it is necessary to break the 78.80 area to the resistance of 79.96. Meanwhile, for a downtrend, oil prices need to pass through the 76.60 support area first and test the 75.36 support again.
|
PREVIOUS RANGE |
||||||
|
OPEN |
HIGH |
LOW |
CLOSE |
PREV.CLOSE |
CHANGE |
%CHANGE |
|
78.43 |
78.82 |
76.52 |
77.64 |
78.39 |
-0.75 |
-0.96% |
|
DAILY PIVOT POINT |
||||||
|
R3 |
R2 |
R1 |
PIVOT |
S1 |
S2 |
S3 |
|
81.10 |
79.96 |
78.80 |
77.66 |
76.50 |
75.36 |
74.20 |
So, that's the explanation of "Technical Daily Analysis: February 10, 2023 – Forex Market Moving Flat". Also read our other articles, such as an explanation of how to buy cryptocurrencies, only in the GIC Journal. Don't forget to practice your trading skills by getting the Scalping Ebook and following Live Trading on NFP Live Trading. Make sure, download GIC Mobile Apps on the Google Play Store.


