 Last:
Last: 
The following is the technical daily analysis for August 7, 2024. The data and analysis contained in this bulletin can be widely used for your trading. However, it is important to note that GICTrade and the data providers are not responsible for your trading results.
Below, we will provide forecasts for price movements in Forex and Commodities, along with calculations for Pivot Point levels, Resistance, and Support.
GBPUSD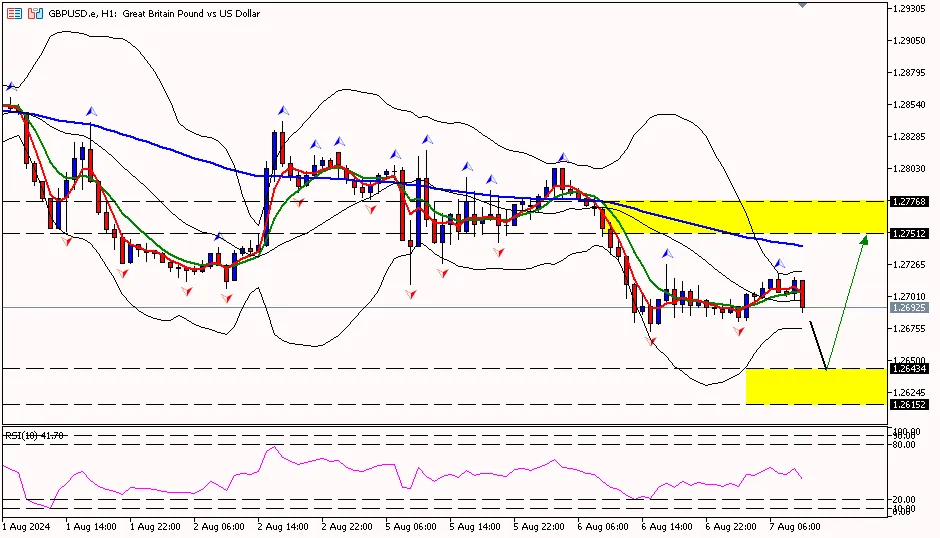
GBP/USD on the 1-hour timeframe is below the pivot area at 1.27350, attempting to move down to the first support area at 1.26670 and then towards the second support area at 1.26050. Meanwhile, the RSI indicator is below the pivot area, indicating that the pound sterling has the potential to move lower.
Suggest: Sell 1.27100 TP1 1.26800 TP2 1.26500 SL 1.27400
|
PREVIOUS RANGE |
||||||
|
OPEN |
HIGH |
LOW |
CLOSE |
PREV.CLOSE |
CHANGE |
%CHANGE |
|
1.27733 |
1.28031 |
1.26727 |
1.26917 |
1.27762 |
-0.00845 |
-0.66% |
|
DAILY PIVOT POINT |
||||||
|
R3 |
R2 |
R1 |
PIVOT |
S1 |
S2 |
S3 |
|
1.29280 |
1.28650 |
1.27970 |
1.27350 |
1.26670 |
1.26050 |
1.25370 |
XAUUSD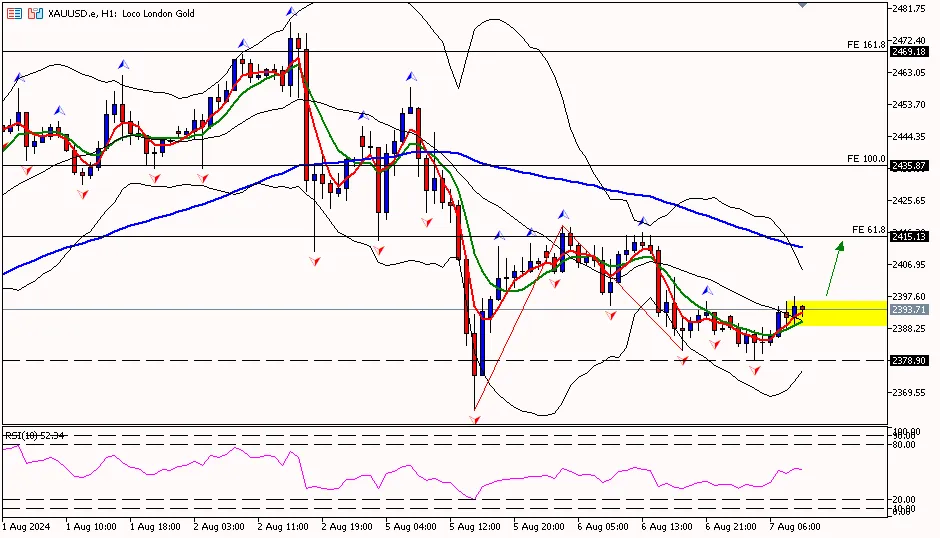
The price of gold on the 1-hour timeframe is above the first support area at 2381.30, attempting to move up towards the pivot area at 2399.80 and then towards the first resistance area at 2417.90. Meanwhile, the RSI indicator is above the pivot area, indicating that the price of gold has the potential to move higher.
Suggest: Buy 2390.00 TP1 2395.00 TP2 2405.00 SL 2380.00
|
PREVIOUS RANGE |
||||||
|
OPEN |
HIGH |
LOW |
CLOSE |
PREV.CLOSE |
CHANGE |
%CHANGE |
|
2410.66 |
2418.33 |
2381.75 |
2388.31 |
2407.26 |
-18.95 |
-0.79% |
|
DAILY PIVOT POINT |
||||||
|
R3 |
R2 |
R1 |
PIVOT |
S1 |
S2 |
S3 |
|
2454.40 |
2436.40 |
2417.90 |
2399.80 |
2381.30 |
2363.20 |
2344.70 |
CLSK (OIL)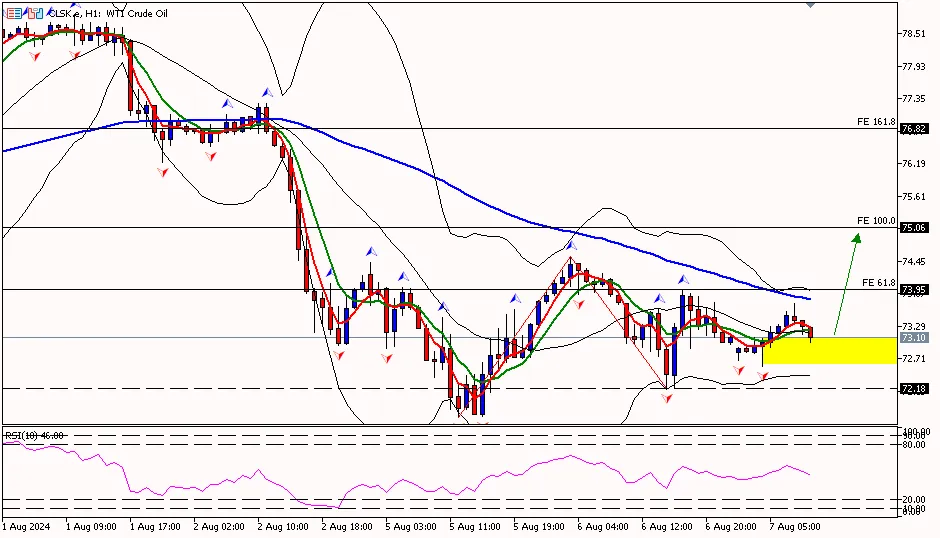
The price of oil on the 1-hour timeframe is at the pivot area of 73.27, with the potential to move up to the first resistance area at 74.35 and then towards the second resistance area at 75.61. Meanwhile, the RSI indicator is at the pivot area, indicating that the price of oil has the potential to move higher.
Suggest: Buy 73.00 TP1 73.50 TP2 74.00 SL 72.50
|
PREVIOUS RANGE |
||||||
|
OPEN |
HIGH |
LOW |
CLOSE |
PREV.CLOSE |
CHANGE |
%CHANGE |
|
73.87 |
74.53 |
72.19 |
73.09 |
73.84 |
-0.75 |
-1.02% |
|
DAILY PIVOT POINT |
||||||
|
R3 |
R2 |
R1 |
PIVOT |
S1 |
S2 |
S3 |
|
76.69 |
75.61 |
74.35 |
73.27 |
72.01 |
70.93 |
69.67 |


