 Last:
Last: 
The following is the technical daily analysis for August 6, 2024. The data and analysis provided in this bulletin can be used broadly for your trading. However, it is important to note that GICTrade and the data providers are not responsible for your trading results.
Next, we will provide information on the forecast for price movements in Forex and commodities, along with calculations for pivot point levels, resistance, and support.
AUDUSD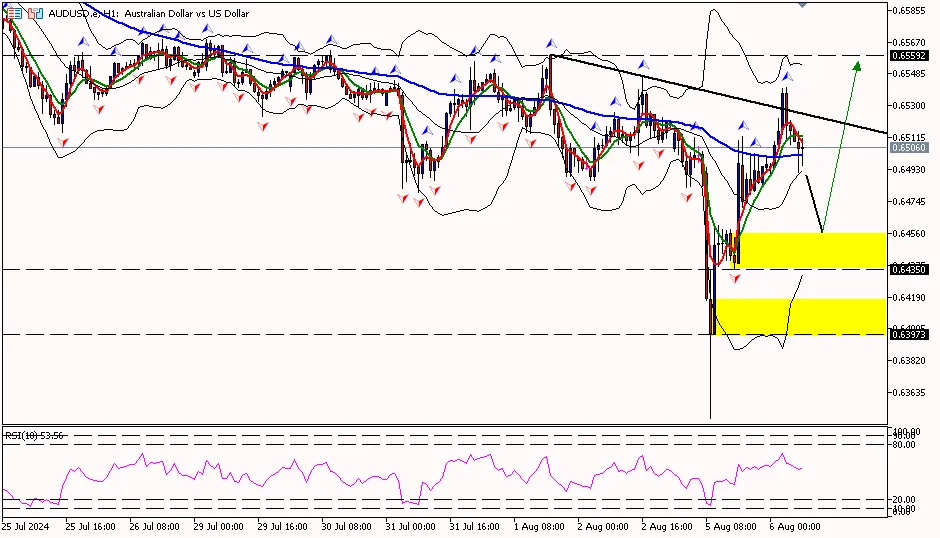
AUD/USD on the 1-hour period is above the pivot area at 0.66790, trying to move up towards the first resistance area at 0.64670 and then towards the second resistance area at 0.66360. Meanwhile, the RSI indicator is above the pivot area, indicating that the Aussie has the potential to move higher.
Suggest: Buy 0.64670 TP1 0.65000 TP2 0.65300 SL 0.64350
|
PREVIOUS RANGE |
||||||
|
OPEN |
HIGH |
LOW |
CLOSE |
PREV.CLOSE |
CHANGE |
%CHANGE |
|
0.65055 |
0.65177 |
0.63487 |
0.64961 |
0.65188 |
-0.00227 |
-0.35% |
|
DAILY PIVOT POINT |
||||||
|
R3 |
R2 |
R1 |
PIVOT |
S1 |
S2 |
S3 |
|
0.67540 |
0.66360 |
0.65850 |
0.64670 |
0.64160 |
0.62980 |
0.62470 |
XAUUSD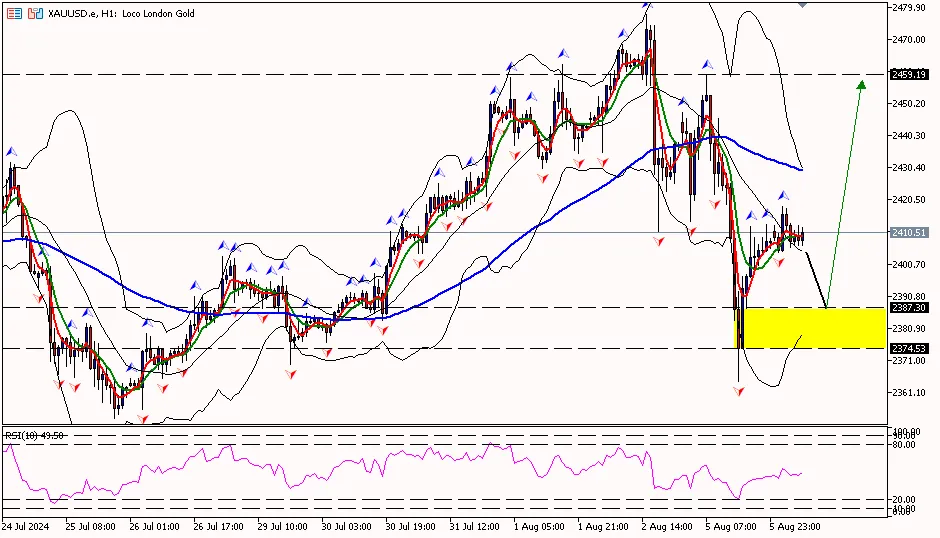
The gold price on the 1-hour period is above the first support area at 2378.70, attempting to move up towards the pivot area at 2418.70 and then towards the first resistance area at 2473.10. Meanwhile, the RSI indicator is at the pivot area, suggesting that the gold price has the potential to move higher.
Suggest: Buy 2378.00 TP1 2388.00 TP2 2408.00 SL 2368.00
|
PREVIOUS RANGE |
||||||
|
OPEN |
HIGH |
LOW |
CLOSE |
PREV.CLOSE |
CHANGE |
%CHANGE |
|
2444.44 |
2458.74 |
2364.32 |
2407.26 |
2437.25 |
-29.99 |
-1.23% |
|
DAILY PIVOT POINT |
||||||
|
R3 |
R2 |
R1 |
PIVOT |
S1 |
S2 |
S3 |
|
2567.50 |
2513.10 |
2473.10 |
2418.70 |
2378.70 |
2324.30 |
2284.20 |
CLSK (OIL)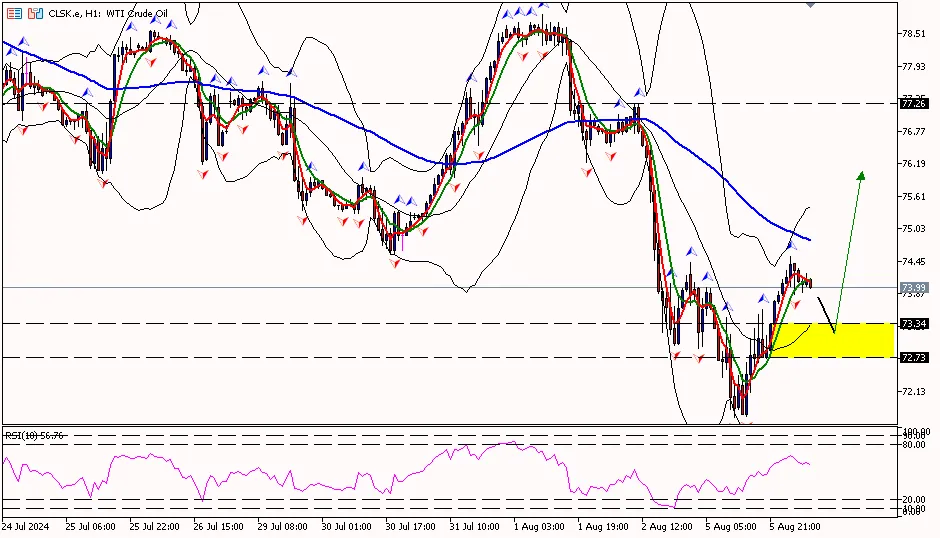
The oil price on the 1-hour period is above the pivot area at 73.31, with the potential to move up to the first resistance area at 74.96 and then towards the second resistance area at 76.08. Meanwhile, the RSI indicator is above the pivot area, indicating that the oil price has the potential to move higher.
Suggest: Buy 73.30 TP1 74.00 TP2 75.00 SL 73.70
|
PREVIOUS RANGE |
||||||
|
OPEN |
HIGH |
LOW |
CLOSE |
PREV.CLOSE |
CHANGE |
%CHANGE |
|
74.21 |
74.43 |
71.66 |
73.84 |
74.08 |
-0.24 |
-0.32% |
|
DAILY PIVOT POINT |
||||||
|
R3 |
R2 |
R1 |
PIVOT |
S1 |
S2 |
S3 |
|
77.73 |
76.08 |
74.96 |
73.31 |
72.19 |
70.54 |
69.42 |


