 Last:
Last: 
The following is the technical daily analysis for August 12, 2024. The data and analysis contained in this bulletin can be widely used for your trading. However, it is important to note that GICTrade and the data providers are not responsible for your trading results.
Below, we will provide forecasts for price movements in Forex and Commodities, along with calculations for Pivot Point levels, Resistance, and Support.
AUDUSD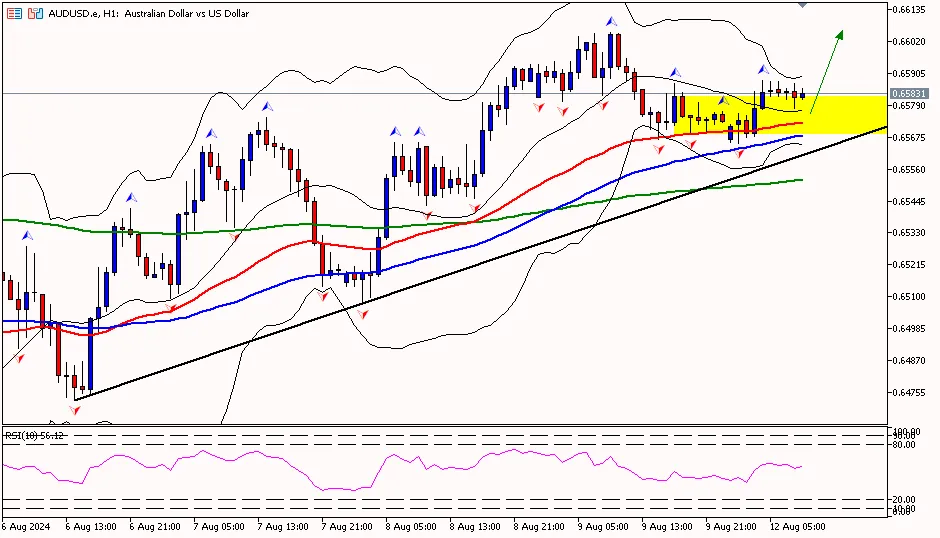
AUD/USD on the 1-hour timeframe is above the first support area at 0.65590, attempting to move up towards the pivot area at 0.65820 and then towards the first resistance area at 0.65970. Meanwhile, the RSI indicator is above the pivot area, indicating that the Aussie has the potential to move higher.
Suggest: Buy 0.65700 TP1 0.65900 TP2 0.66100 SL 0.65500
|
PREVIOUS RANGE |
||||||
|
OPEN |
HIGH |
LOW |
CLOSE |
PREV.CLOSE |
CHANGE |
%CHANGE |
|
0.65817 |
0.66053 |
0.65667 |
0.65732 |
0.65923 |
-0.00191 |
-0.29% |
|
DAILY PIVOT POINT |
||||||
|
R3 |
R2 |
R1 |
PIVOT |
S1 |
S2 |
S3 |
|
0.66360 |
0.66210 |
0.65970 |
0.65820 |
0.65590 |
0.65430 |
0.65200 |
XAUUSD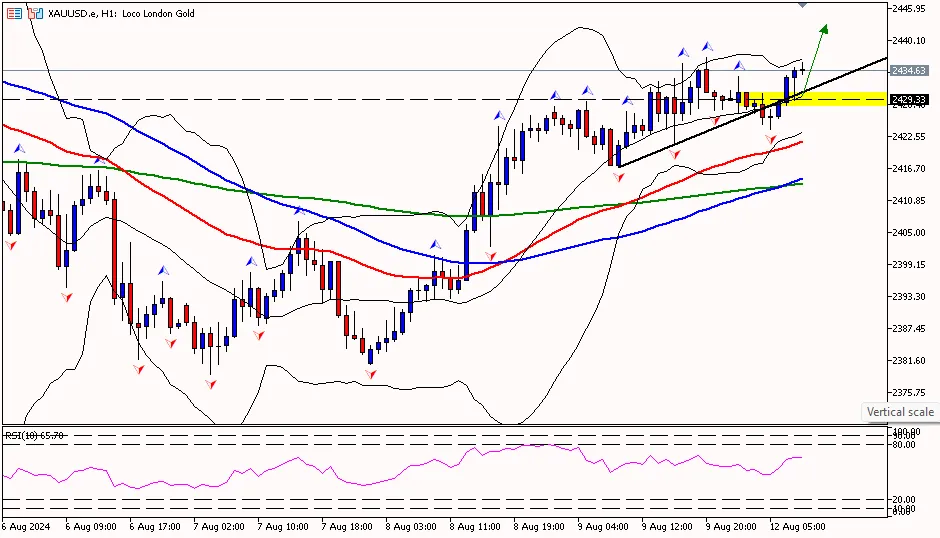
The price of gold on the 1-hour timeframe is above the pivot area at 2427.60, attempting to move up towards the first resistance area at 2438.30 and then towards the second resistance area at 2447.70. Meanwhile, the RSI indicator is above the pivot area, indicating that the price of gold has the potential to move higher.
Suggest: Buy 2430.00 TP1 2435.00 TP2 2445.00 SL 2425.00
|
PREVIOUS RANGE |
||||||
|
OPEN |
HIGH |
LOW |
CLOSE |
PREV.CLOSE |
CHANGE |
%CHANGE |
|
2426.92 |
2437.04 |
2416.90 |
2429.38 |
2425.87 |
3.51 |
0.14% |
|
DAILY PIVOT POINT |
||||||
|
R3 |
R2 |
R1 |
PIVOT |
S1 |
S2 |
S3 |
|
2458.40 |
2447.70 |
2438.30 |
2427.60 |
2418.20 |
2407.50 |
2398.00 |
CLSK (OIL)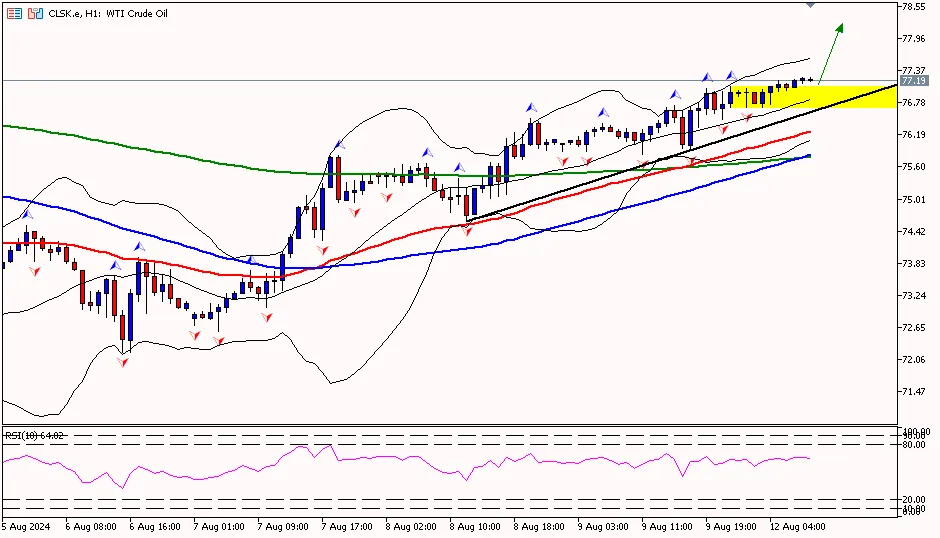
The price of oil on the 1-hour timeframe is at the pivot area of 76.61, with the potential to move up to the first resistance area at 77.39 and then towards the second resistance area at 77.85. Meanwhile, the RSI indicator is above the pivot area, indicating that the price of oil has the potential to move higher.
Suggest: Buy 77.00 TP1 77.40 TP2 77.80 SL 76.60
|
PREVIOUS RANGE |
||||||
|
OPEN |
HIGH |
LOW |
CLOSE |
PREV.CLOSE |
CHANGE |
%CHANGE |
|
76.02 |
77.07 |
75.83 |
76.94 |
76.10 |
0.84 |
1.10% |
|
DAILY PIVOT POINT |
||||||
|
R3 |
R2 |
R1 |
PIVOT |
S1 |
S2 |
S3 |
|
78.63 |
77.85 |
77.39 |
76.61 |
76.15 |
75.37 |
74.91 |
So, that concludes the explanation of "Technical Daily Analysis: August 12, 2024 – Gold Heading Towards $2450." Also, check out our other articles, such as the explanation of how to buy cryptocurrency, only in the GIC Journal. Don't forget to hone your trading skills by getting the Ebook Scalping guide. Be sure to download the GIC Mobile App from the Google Play Store.


