 Last:
Last: 
The following is a technical daily analysis, March 28, 2024. The data and analysis contained in this newsletter can be used on a wide scale for your trading. However, it is important to note that GICTrade and its data providers are not responsible for your trading results.
In the following, we will inform you about the forecast of price movements in Forex and Commodities which is equipped with the calculation of Pivot points, Resistance and Support levels.
EURUSD
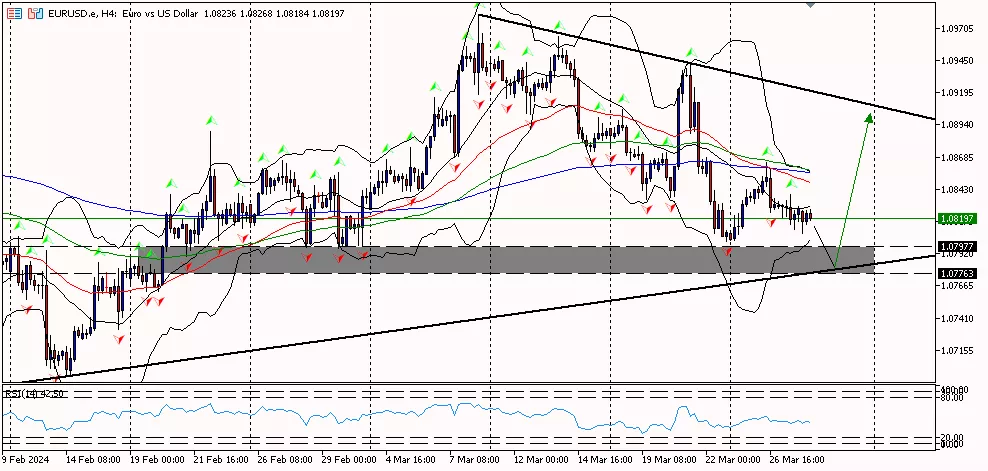
EUR/USD on the 4-hour period is above the first support area at 1.08150, trying to move down to the pivot area at 1.08270 all the way to the first resistance at 1.08430. While the RSI indicator is below the pivot area, the euro has the potential to move down first before rebounding.
Suggest: Buy 1.08000 TP1 1.08270 TP2 1.08430 SL 1.07800
|
PREVIOUS RANGE |
||||||
|
OPEN |
HIGH |
LOW |
CLOSE |
PREV.CLOSE |
CHANGE |
%CHANGE |
|
1.08304 |
1.08393 |
1.08109 |
1.08278 |
1.08312 |
-0.00034 |
-0.03% |
|
DAILY PIVOT POINT |
||||||
|
R3 |
R2 |
R1 |
PIVOT |
S1 |
S2 |
S3 |
|
1.08720 |
1.08550 |
1.08430 |
1.08270 |
1.08150 |
1.07990 |
1.07860 |
GBPUSD
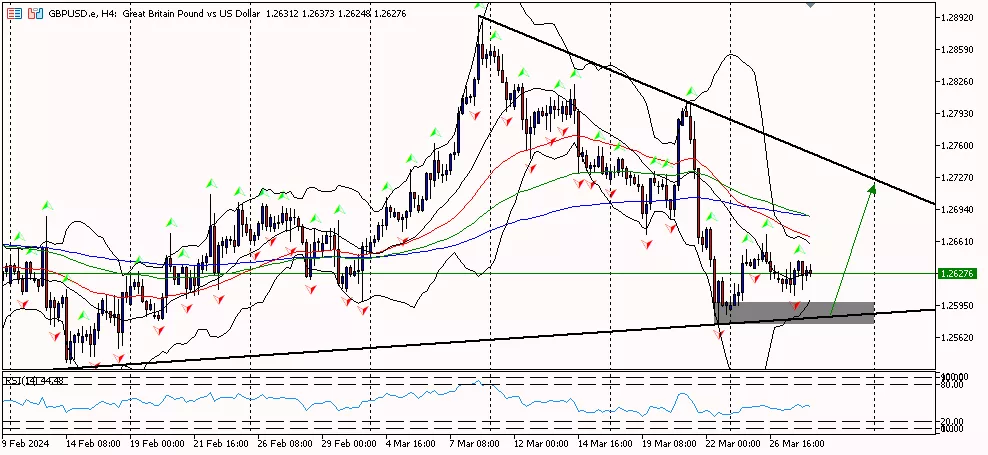
GBP/USD on the 4-hour period is above the first support area at 1.26170, trying to move up to the pivot area at 1.26290 all the way to the first resistance at 1.26530. While the RSI indicator is below the pivot area, the pound has the potential to move down first before rebounding.
Suggest: Buy 1.26000 TP1 1.26270 TP2 1.26530 SL 1.25800
|
PREVIOUS RANGE |
||||||
|
OPEN |
HIGH |
LOW |
CLOSE |
PREV.CLOSE |
CHANGE |
%CHANGE |
|
1.26310 |
1.26411 |
1.26055 |
1.26403 |
1.26277 |
0.00126 |
0.10% |
|
DAILY PIVOT POINT |
||||||
|
R3 |
R2 |
R1 |
PIVOT |
S1 |
S2 |
S3 |
|
1.26880 |
1.26650 |
1.26530 |
1.26290 |
1.26170 |
1.25930 |
1.25810 |
AUDUSD
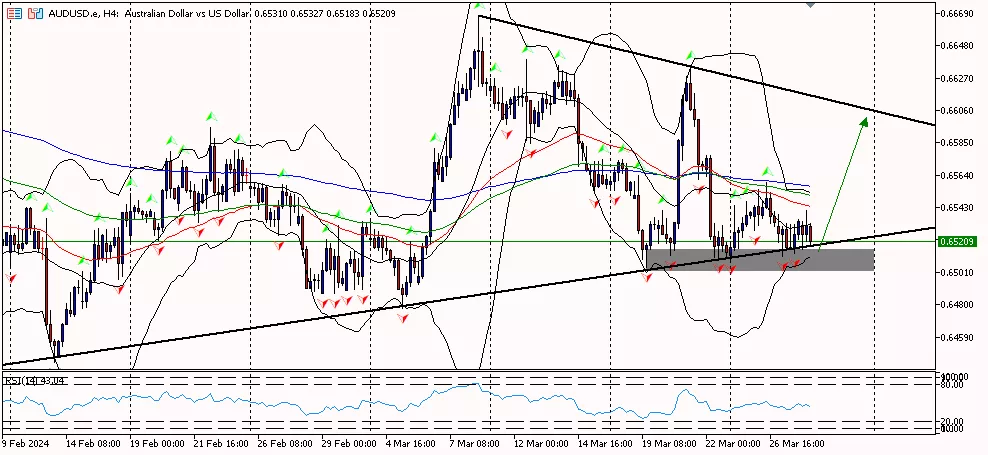
AUD/USD on the 4-hour period is above the first support area at 0.65190, trying to move up to the pivot area at 0.65290 all the way to the first resistance area at 0.65470. While the RSI indicator is below the pivot area, the aussie has the potential to fall first before rebounding.
Suggest: Buy 0.65090 TP1 0.65290 TP2 0.65470 SL 0.64890
|
PREVIOUS RANGE |
||||||
|
OPEN |
HIGH |
LOW |
CLOSE |
PREV.CLOSE |
CHANGE |
%CHANGE |
|
0.65310 |
0.65388 |
0.65114 |
0.65343 |
0.65331 |
0.00012 |
0.02% |
|
DAILY PIVOT POINT |
||||||
|
R3 |
R2 |
R1 |
PIVOT |
S1 |
S2 |
S3 |
|
0.65740 |
0.65560 |
0.65470 |
0.65290 |
0.65190 |
0.65020 |
0.64920 |
USDCHF
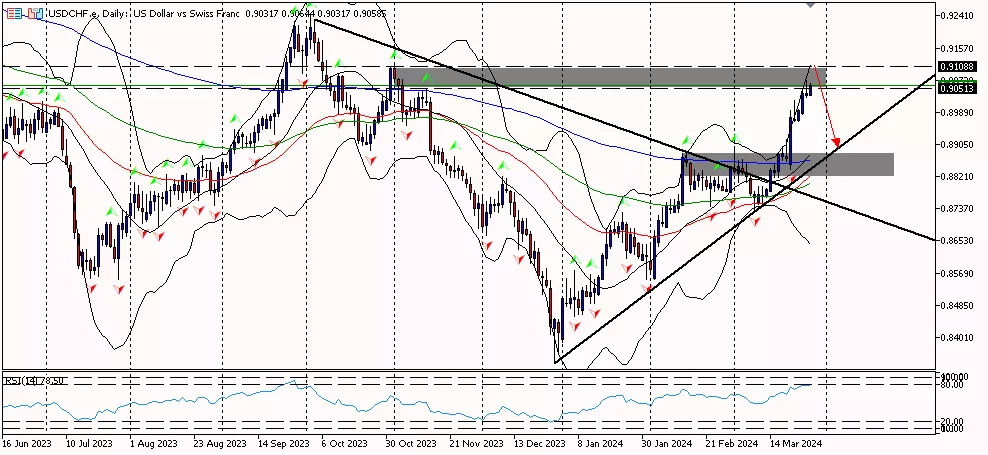
USD/CHF on the 4-hour period is above the first resistance area at 0.90570, trying to move up to the second resistance area at 0.90860 all the way to the third resistance area at 0.91010. While the RSI indicator is above the pivot area, the Swiss franc currency has the potential to move up first before falling.
Suggest: Sell 0.90860 TP1 0.90570 TP2 0.90420 SL 0.91010
|
PREVIOUS RANGE |
||||||
|
OPEN |
HIGH |
LOW |
CLOSE |
PREV.CLOSE |
CHANGE |
%CHANGE |
|
0.90321 |
0.90715 |
0.90273 |
0.90376 |
0.90393 |
-0.00017 |
-0.02% |
|
DAILY PIVOT POINT |
||||||
|
R3 |
R2 |
R1 |
PIVOT |
S1 |
S2 |
S3 |
|
0.91010 |
0.90860 |
0.90570 |
0.90420 |
0.90130 |
0.89980 |
0.89680 |
USDJPY

USD/JPY on the 4-hour period is below the pivot area at 151.460, trying to move down towards the first support area at 150.950 all the way to the second support area at 150.520. While the RSI indicator is above the pivot area, the yen has the potential to move up first before falling.
Suggest: Sell 151.500 TP1 151.200 TP2 150.950 SL 151.800
|
PREVIOUS RANGE |
||||||
|
OPEN |
HIGH |
LOW |
CLOSE |
PREV.CLOSE |
CHANGE |
%CHANGE |
|
151.511 |
151.971 |
151.027 |
151.319 |
151.553 |
-0.234 |
-0.15% |
|
DAILY PIVOT POINT |
||||||
|
R3 |
R2 |
R1 |
PIVOT |
S1 |
S2 |
S3 |
|
152.840 |
152.400 |
151.890 |
151.460 |
150.950 |
150.520 |
150.010 |
XUL (LOCO LONDON GOLD)
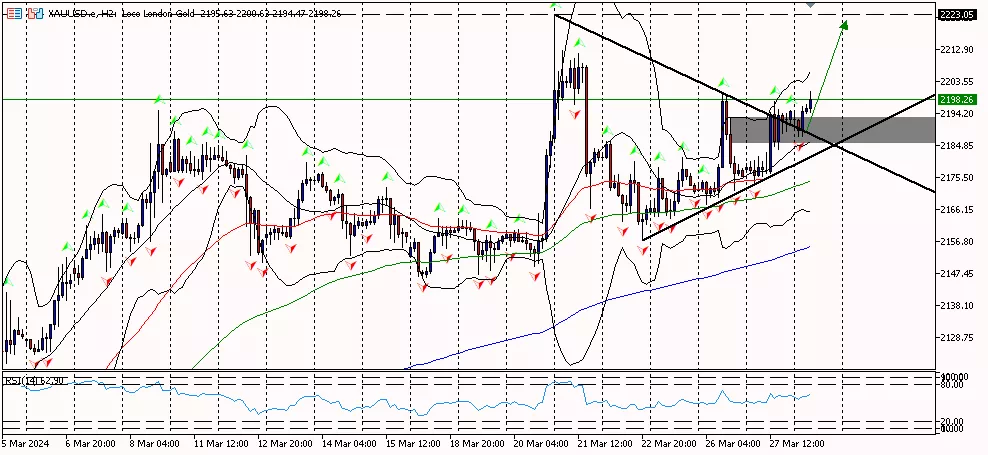
Gold prices in the 4-hour period are above the pivot area at 2185.90, trying to move up towards the first resistance area at 2198.30 until towards the second resistance area at 2210.10. While the RSI indicator is above the pivot area, the price of gold has the potential to move further up.
Suggest: Sell 2193.00.00 TP1 2196.00 TP2 2201.00 SL 2188.00
|
PREVIOUS RANGE |
||||||
|
OPEN |
HIGH |
LOW |
CLOSE |
PREV.CLOSE |
CHANGE |
%CHANGE |
|
2177.95 |
2197.61 |
2173.46 |
2194.77 |
2175.92 |
18.85 |
0.87% |
|
DAILY PIVOT POINT |
||||||
|
R3 |
R2 |
R1 |
PIVOT |
S1 |
S2 |
S3 |
|
2222.50 |
2210.10 |
2198.30 |
2185.90 |
2174.20 |
2161.80 |
2150.00 |
CLSK (OIL)
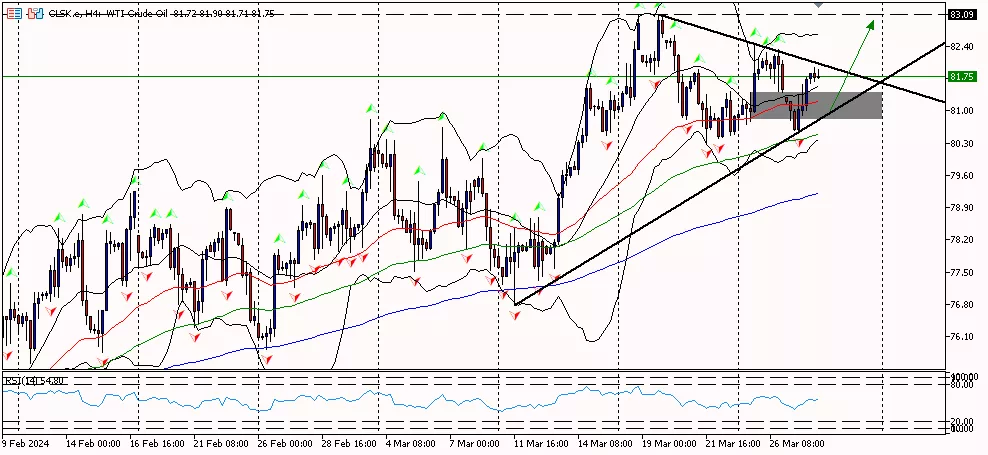
Oil prices in the 1-hour period are above the pivot area at 81.31, potentially moving up to the first resistance area at 82.08 to the second resistance area at 82.49. Meanwhile, the RSI indicator is above the pivot area, so oil prices have the potential to move further up.
Suggest: Buy 81.30 TP1 81.80 TP2 82.30 SL 80.90
|
PREVIOUS RANGE |
||||||
|
OPEN |
HIGH |
LOW |
CLOSE |
PREV.CLOSE |
CHANGE |
%CHANGE |
|
81.28 |
81.72 |
80.54 |
81.67 |
81.46 |
0.21 |
0.26% |
|
DAILY PIVOT POINT |
||||||
|
R3 |
R2 |
R1 |
PIVOT |
S1 |
S2 |
S3 |
|
83.26 |
82.49 |
82.08 |
81.31 |
80.90 |
80.13 |
79.72 |
So, that's the explanation of "Technical Daily Analysis: March 28, 2024 – Jobless Claims Rise, Dollar Has the Potential to Plummet". Also read our other articles, such as an explanation of how to buy cryptocurrencies, only in the GIC Journal. Don't forget to practice your trading skills by getting the Scalping Ebook and following Live Trading on NFP Live Trading. Make sure, download GIC Mobile Apps on the Google Play Store.


