 Last:
Last: 
The following is a technical daily analysis, October 17, 2023. The data and analysis contained in this newsletter can be used on a wide scale for your trading. However, it is important to note that GICTrade and its data providers are not responsible for your trading results.
So, it's your own responsibility. Before knowing today's technical analysis, immediately register yourself to participate in GIC Big Deals which is here to offer exclusive benefits and a variety of attractive prizes. This event will only take place for a limited time, from July 10 - December 31, 2023.
In the following, we will inform you about the forecast of price movements in Forex and Commodities which is equipped with the calculation of Pivot points, Resistance and Support levels.
EURUSD
.webp)
EUR/USD on the 1-hour period tried to move down, touching the support level at 1.05310 until heading to the next support level at 1.05010. The downward trend can also be seen from the FXBot template, where the EUR figure is lower by 2.0 than the USD figure of 6.1. While the bearish bias is also supported by a sell signal indicated by a red arrow.
Suggest: Sell 1.05310 TP1 1.05010 TP2 1.04730 SL 1.05600
|
PREVIOUS RANGE |
||||||
|
OPEN |
HIGH |
LOW |
CLOSE |
PREV.CLOSE |
CHANGE |
%CHANGE |
|
1.05026 |
1.05608 |
1.05024 |
1.05577 |
1.05067 |
0.00510 |
0.49% |
|
DAILY PIVOT POINT |
||||||
|
R3 |
R2 |
R1 |
PIVOT |
S1 |
S2 |
S3 |
|
1.06180 |
1.05890 |
1.05600 |
1.05310 |
1.05010 |
1.04730 |
1.04430 |
GBPUSD
.webp)
GBP/USD on the 1-hour period tried to move down, touching the support level at 1.21680 until heading towards the next support level at 1.21190. The downward trend can also be seen from the FXBot template, where the GBP figure is lower by 5.1 than the USD figure of 6.0. While the bearish bias is also supported by a sell signal indicated by a red arrow.
Suggest: Sell 1.21680 TP1 1.21400 TP2 1.21190 SL 1.21900
|
PREVIOUS RANGE |
||||||
|
OPEN |
HIGH |
LOW |
CLOSE |
PREV.CLOSE |
CHANGE |
%CHANGE |
|
1.21219 |
1.22175 |
1.21187 |
1.22151 |
1.21323 |
0.00828 |
0.68% |
|
DAILY PIVOT POINT |
||||||
|
R3 |
R2 |
R1 |
PIVOT |
S1 |
S2 |
S3 |
|
1.23160 |
1.22670 |
1.22170 |
1.21680 |
1.21190 |
1.20690 |
1.20200 |
AUDUSD
.webp)
AUD/USD on the 1-hour period tried to move up, touching the resistance level of 0.63650 until heading to the next resistance level at 0.63880. The uptrend is also supported by the FXBot template, where the AUD figure is higher by 6.7 than the USD figure of 6.0. While the bullish bias is also supported by a buy signal indicated by a green arrow.
Suggest: Sell 0.63650 TP1 0.63400 TP2 0.63190 SL 0.63880
|
PREVIOUS RANGE |
||||||
|
OPEN |
HIGH |
LOW |
CLOSE |
PREV.CLOSE |
CHANGE |
%CHANGE |
|
0.62972 |
0.63430 |
0.62967 |
0.63403 |
0.62946 |
0.00457 |
0.73% |
|
DAILY PIVOT POINT |
||||||
|
R3 |
R2 |
R1 |
PIVOT |
S1 |
S2 |
S3 |
|
0.63880 |
0.63650 |
0.63410 |
0.63190 |
0.62950 |
0.62730 |
0.62490 |
USDCHF
.webp)
Daily technical analysis for the USD/CHF pair on the 1-hour period tried to move up, touching the resistance level at 0.90220 to the next resistance level at 0.9055. The downward trend can also be seen from the FXBot template, where the CHF figure is lower by 2.8 than the USD figure of 6.2. While the bullish bias is also supported by a buy signal indicated by a green arrow.
Suggest: Buy 0.90220 TP1 0.90550 TP2 0.90690 SL 0.90000
|
PREVIOUS RANGE |
||||||
|
OPEN |
HIGH |
LOW |
CLOSE |
PREV.CLOSE |
CHANGE |
%CHANGE |
|
0.90008 |
0.90402 |
0.89936 |
0.89992 |
0.90183 |
-0.00191 |
-0.21% |
|
DAILY PIVOT POINT |
||||||
|
R3 |
R2 |
R1 |
PIVOT |
S1 |
S2 |
S3 |
|
0.90690 |
0.90550 |
0.90220 |
0.90080 |
0.89760 |
0.89610 |
0.89290 |
USDJPY
.webp)
USD/JPY in the 1-hour period tried to move down, touching the support level at 149,470 again until the next support level at 149,200. The downward trend is also supported by the FXBot template, where the JPY figure is higher by 6.3 than the USD figure of 6.2. While the bearish bias is also supported by a sell signal indicated by a red arrow.
Suggest: Buy 149.470 TP1 149.630 TP2 149.910 SL 149.200
|
PREVIOUS RANGE |
||||||
|
OPEN |
HIGH |
LOW |
CLOSE |
PREV.CLOSE |
CHANGE |
%CHANGE |
|
149.320 |
149.745 |
149.309 |
149.500 |
149.531 |
-0.031 |
-0.02% |
|
DAILY PIVOT POINT |
||||||
|
R3 |
R2 |
R1 |
PIVOT |
S1 |
S2 |
S3 |
|
150.070 |
149.910 |
149.630 |
149.470 |
149.200 |
149.030 |
148.760 |
XUL (LOCO LONDON GOLD)
.webp)
Gold prices in the 1-hour period tried to move down, touching the support level at 1912.90 again to the next support level at 1899.70. Meanwhile, for further bullish bias, the gold price needs to pass the resistance level at 1934.30 to the next resistance level at 1942.70.
Suggest: Sell 1916.00 TP1 1912.90 TP2 1905.00 SL 1921.20
|
PREVIOUS RANGE |
||||||
|
OPEN |
HIGH |
LOW |
CLOSE |
PREV.CLOSE |
CHANGE |
%CHANGE |
|
1927.83 |
1929.54 |
1908.07 |
1919.41 |
1928.84 |
-9.43 |
-0.49% |
|
DAILY PIVOT POINT |
||||||
|
R3 |
R2 |
R1 |
PIVOT |
S1 |
S2 |
S3 |
|
1955.80 |
1942.70 |
1934.30 |
1921.20 |
1912.90 |
1899.70 |
1891.40 |
CLSK (OIL)
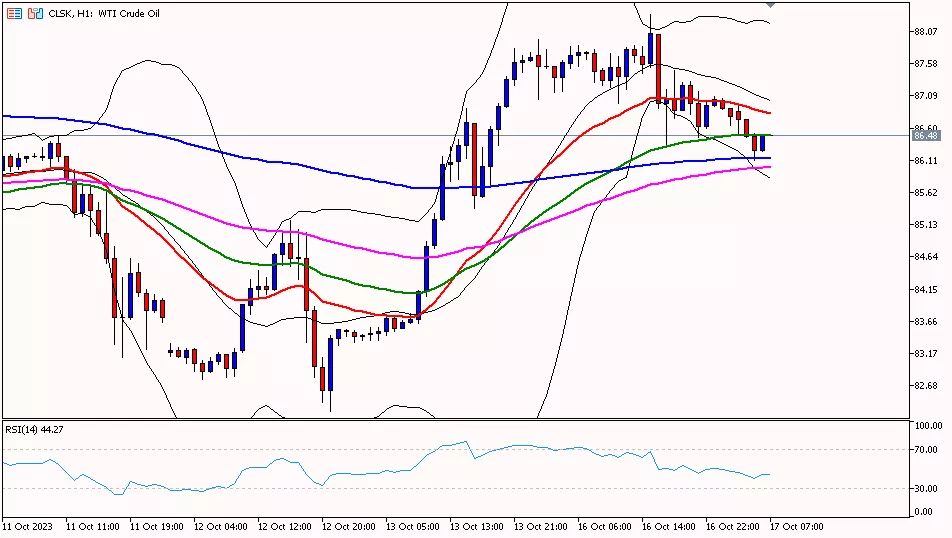
Daily technical analysis for oil prices in the 1-hour period is trying to move down, it needs to pass the support level at 86.12 to reach the next support level at 85.21. Meanwhile, for a bullish bias, oil prices need to pass the resistance level at 87.22 to reach the next resistance level at 88.13.
Suggest: Sell 86.50 TP1 86.12 TP2 85.50 SL 87.00
|
PREVIOUS RANGE |
||||||
|
OPEN |
HIGH |
LOW |
CLOSE |
PREV.CLOSE |
CHANGE |
%CHANGE |
|
87.76 |
88.32 |
86.31 |
87.04 |
87.67 |
-0.63 |
-0.72% |
|
DAILY PIVOT POINT |
||||||
|
R3 |
R2 |
R1 |
PIVOT |
S1 |
S2 |
S3 |
|
90.14 |
89.23 |
88.13 |
87.22 |
86.12 |
85.21 |
84.11 |
So, that's the explanation of "Technical Daily Analysis: October 17, 2023 – US Retail Sales Expected to Fall, What is the Fate of the Dollar?". Also read our other articles, such as an explanation of how to buy cryptocurrencies, only in the GIC Journal. Don't forget to practice your trading skills by getting the Scalping Ebook and following Live Trading on NFP Live Trading. Make sure, download GIC Mobile Apps on the Google Play Store.


