 Last:
Last: 
Here is the daily technical analysis for September 9, 2024. The data and analysis in this bulletin can be widely used for your trading. However, please note that GICTrade and the data providers are not responsible for your trading results.
Below, we will provide forecasts for price movements in Forex and Commodities, complete with calculations of Pivot levels, Resistance, and Support.
GBPUSD
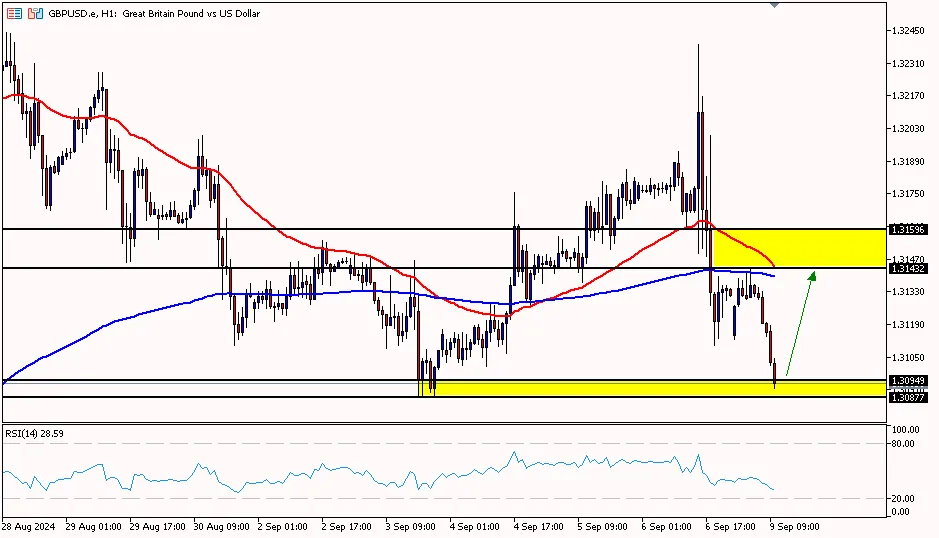
The GBP/USD on the 1-hour period is above the first support area at 1.30870, attempting to move up towards the pivot area at 1.31630 and up to the first resistance area at 1.32160. Meanwhile, the RSI indicator is below the pivot area in oversold conditions, suggesting that the pound has the potential to rebound.
Suggest: Buy 1.31000 TP1 1.31250 TP2 1.31500 SL 1.30750
GBPUSD
The GBP/USD on the 1-hour period is above the first support area at 1.30870, attempting to move up towards the pivot area at 1.31630 and up to the first resistance area at 1.32160. Meanwhile, the RSI indicator is below the pivot area in oversold conditions, suggesting that the pound has the potential to rebound.
Suggest: Buy 1.31000 TP1 1.31250 TP2 1.31500 SL 1.30750
|
PREVIOUS RANGE |
||||||
|
OPEN |
HIGH |
LOW |
CLOSE |
PREV.CLOSE |
CHANGE |
%CHANGE |
|
1.31729 |
1.32388 |
1.31101 |
1.31316 |
1.31801 |
-0.00485 |
-0.37% |
|
DAILY PIVOT POINT |
||||||
|
R3 |
R2 |
R1 |
PIVOT |
S1 |
S2 |
S3 |
|
1.33450 |
1.32920 |
1.32160 |
1.31630 |
1.30870 |
1.30340 |
1.29590 |
XAUUSD
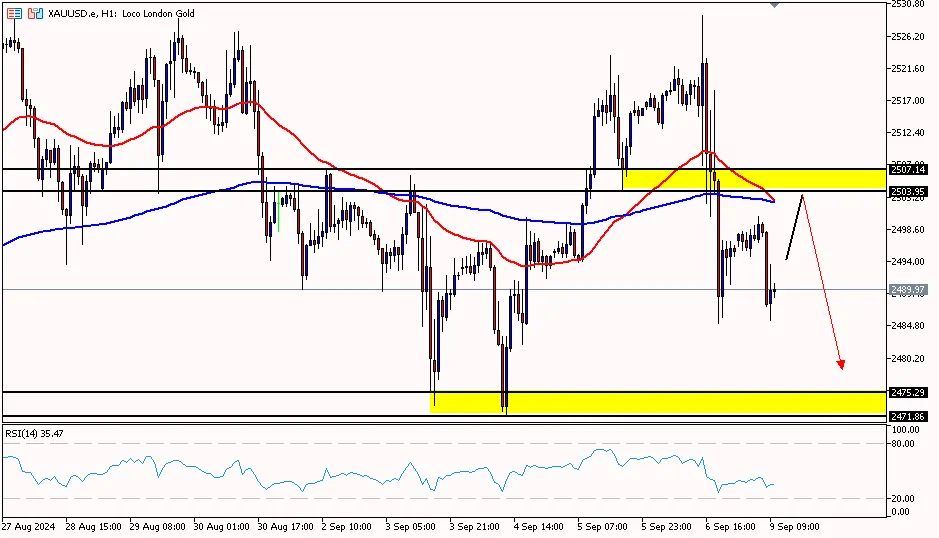
Gold prices on the 1-hour period are above the first support area at 2484.00, attempting to move up towards the pivot area at 2506.60 and further to the first resistance area at 2528.10. Meanwhile, the RSI indicator is below the pivot area in oversold conditions, suggesting that gold has the potential to rebound.
Suggest: Sell 2489.00 TP1 2494.00 TP2 2499.00 SL 2484.00
|
PREVIOUS RANGE |
||||||
|
OPEN |
HIGH |
LOW |
CLOSE |
PREV.CLOSE |
CHANGE |
%CHANGE |
|
2516.73 |
2529.19 |
2485.13 |
2495.44 |
2515.79 |
-20.35 |
-0.81% |
|
DAILY PIVOT POINT |
||||||
|
R3 |
R2 |
R1 |
PIVOT |
S1 |
S2 |
S3 |
|
2572.10 |
2550.70 |
2528.10 |
2506.60 |
2484.00 |
2462.50 |
2440.00 |
CLSK (OIL)
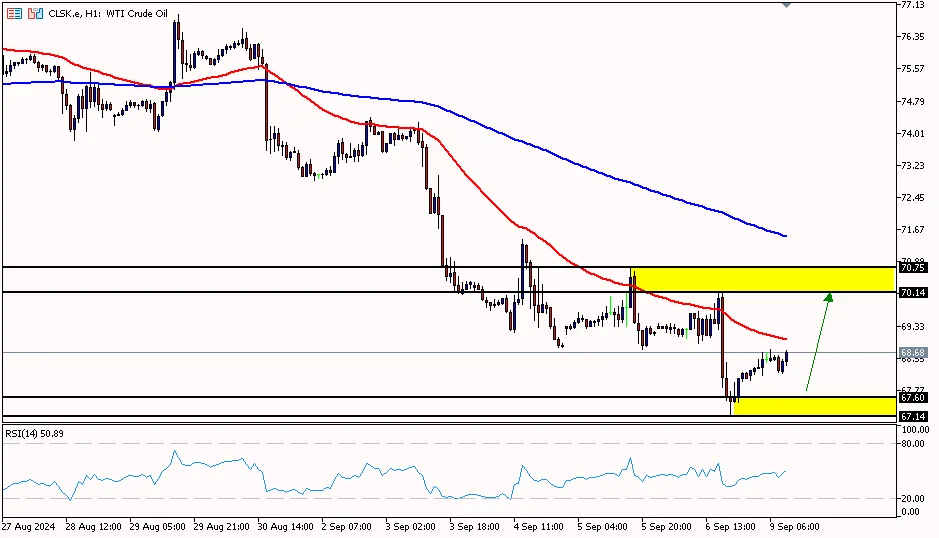
Oil prices on the 1-hour period are above the pivot area at 68.44, with a chance to move up towards the first resistance area at 69.73 and further to the second resistance area at 71.40. Meanwhile, the RSI indicator is at the pivot area, indicating that oil prices have the potential to move upward.
Suggest: Buy 68.60 TP1 69.10 TP2 69.60 SL 68.10
|
PREVIOUS RANGE |
||||||
|
OPEN |
HIGH |
LOW |
CLOSE |
PREV.CLOSE |
CHANGE |
%CHANGE |
|
69.32 |
70.11 |
67.15 |
68.06 |
69.17 |
-1.11 |
-1.60% |
|
DAILY PIVOT POINT |
||||||
|
R3 |
R2 |
R1 |
PIVOT |
S1 |
S2 |
S3 |
|
72.69 |
71.40 |
69.73 |
68.44 |
66.77 |
65.48 |
63.81 |
So, that’s the explanation of the "Technical Daily Analysis: 9 September 2024 – US Dollar in a Bearish Phase." Also, check out our other articles, such as the guide on how to buy cryptocurrency, only on the GIC Journal. Don’t forget to improve your trading skills by getting the Ebook Scalping guide. Make sure to download the GIC Mobile Apps on the Google Play Store.


