 Last:
Last: 
The following is the daily technical analysis for September 30, 2024. The data and analysis in this bulletin can be broadly used for your trading activities. However, it is important to note that GICTrade and the data providers are not responsible for the outcome of your trades.
We will now provide a forecast of price movements in Forex and Commodities, complete with calculations of Pivot points, Resistance, and Support levels.
USDJPY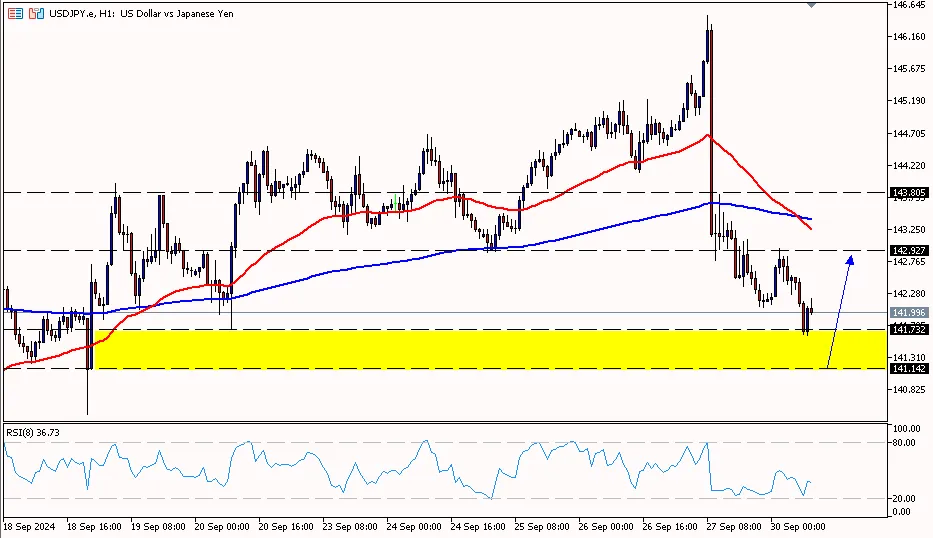
The USD/JPY on the 1-hour period is above the first support area at 141.250, attempting to rise towards the pivot area at 143.780 and potentially reaching the first resistance area at 145.670. Meanwhile, the RSI indicator is below the pivot area, indicating that the yen may move down first before rebounding.
Suggest: Buy 141.500 TP1 142.000 TP2 142.500 SL 141.000
|
PREVIOUS RANGE |
||||||
|
OPEN |
HIGH |
LOW |
CLOSE |
PREV.CLOSE |
CHANGE |
%CHANGE |
|
144.759 |
146.489 |
142.067 |
142.184 |
144.792 |
-2.608 |
-1.80% |
|
DAILY PIVOT POINT |
||||||
|
R3 |
R2 |
R1 |
PIVOT |
S1 |
S2 |
S3 |
|
150.100 |
148.290 |
145.670 |
143.870 |
141.250 |
139.450 |
136.830 |
XAUUSD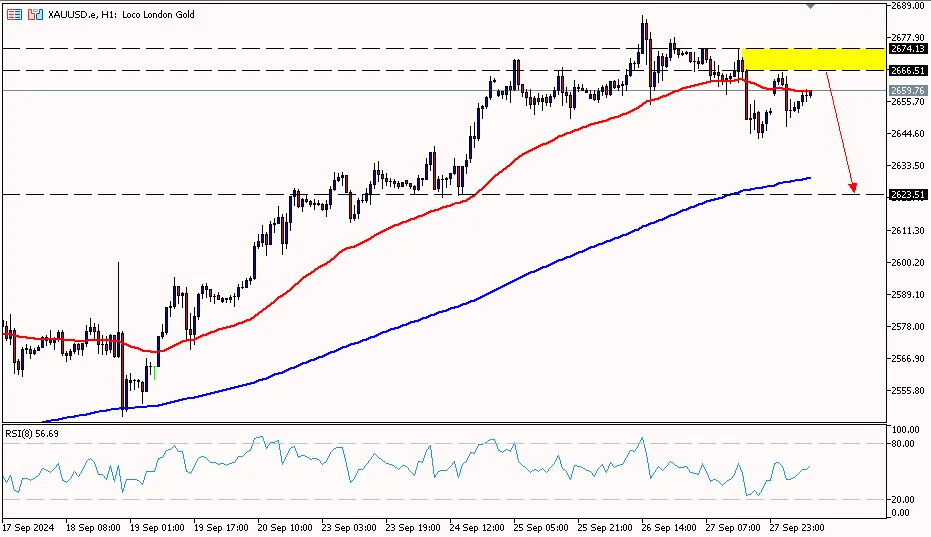
Gold prices on the 1-hour period are below the pivot area at 2660.50, attempting to move down towards the first support area at 2646.70 and potentially reaching the second support area at 2629.40. Meanwhile, the RSI indicator is above the pivot area, suggesting that gold prices may rise first before moving down.
Suggest: Sell 2670.00 TP1 2660.00 TP2 2650.00 SL 2675.00
|
PREVIOUS RANGE |
||||||
|
OPEN |
HIGH |
LOW |
CLOSE |
PREV.CLOSE |
CHANGE |
%CHANGE |
|
2672.07 |
2674.29 |
2643.14 |
2652.39 |
2672.10 |
-19.71 |
-0.74% |
|
DAILY PIVOT POINT |
||||||
|
R3 |
R2 |
R1 |
PIVOT |
S1 |
S2 |
S3 |
|
2709.00 |
2691.70 |
2677.90 |
2660.50 |
2646.70 |
2629.40 |
2615.60 |
CLSK (OIL)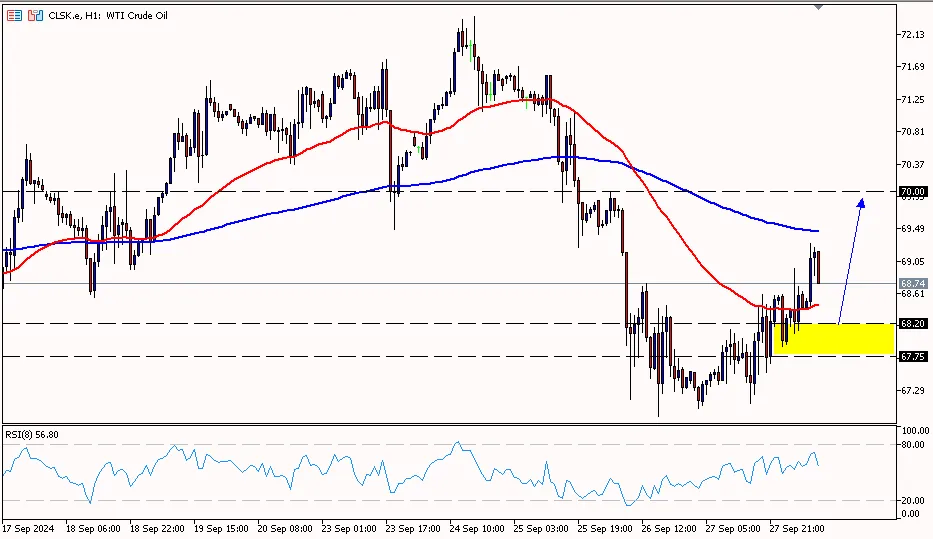
Oil prices on the 1-hour period are above the pivot area at 68.70, with the potential to move up to the first resistance area at 69.09 and possibly reach the second resistance area at 69.62. Meanwhile, the RSI indicator is above the pivot area, suggesting that oil prices have the potential to rise further.
Suggest: Buy 68.20 TP1 68.70 TP2 69.50 SL 67.70
|
PREVIOUS RANGE |
||||||
|
OPEN |
HIGH |
LOW |
CLOSE |
PREV.CLOSE |
CHANGE |
%CHANGE |
|
67.42 |
68.60 |
67.05 |
68.56 |
67.46 |
1.10 |
1.63% |
|
DAILY PIVOT POINT |
||||||
|
R3 |
R2 |
R1 |
PIVOT |
S1 |
S2 |
S3 |
|
70.64 |
69.62 |
69.09 |
68.07 |
67.54 |
66.52 |
65.99 |
That concludes the explanation of “Daily Technical Analysis: September 30, 2024 – Gold Prices Decline Again.” Be sure to read our other articles, such as an explanation on how to buy cryptocurrency, only on Jurnal GIC. Don’t forget to sharpen your trading skills by getting the Scalping Guide Ebook. Make sure to download the GIC Mobile App on Google Play Store.


