 Last:
Last: 
The following is a technical daily analysis, October 29, 2024. The data and analysis contained in this newsletter can be used on a wide scale for your trading. However, it is important to note that GICTrade and its data providers are not responsible for your trading results.
In the following, we will inform you about the forecast of price movements in Forex and Commodities which is equipped with the calculation of Pivot points, Resistance and Support levels.
GBPUSD
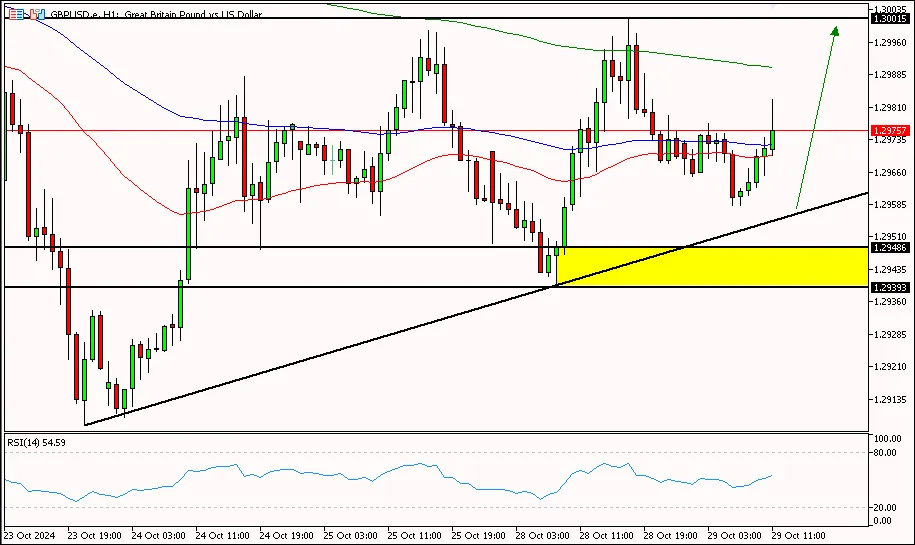
GBP/USD on the 1-hour period is above the pivot area at 1.29700, trying to move up to the first resistance area at 1.30000 all the way to the second resistance area at 1.30320. While the RSI indicator is above the pivot area, the pound has the potential to move further up.
Suggest: Buy 1.29700 TP1 1.30000 TP2 1.30320 SL 1.29400|
PREVIOUS RANGE |
||||||
|
OPEN |
HIGH |
LOW |
CLOSE |
PREV.CLOSE |
CHANGE |
%CHANGE |
|
1.29708 |
1.30015 |
1.29399 |
1.29697 |
1.29595 |
0.00102 |
0.08% |
|
DAILY PIVOT POINT |
||||||
|
R3 |
R2 |
R1 |
PIVOT |
S1 |
S2 |
S3 |
|
1.30620 |
1.30320 |
1.30000 |
1.29700 |
1.29390 |
1.29080 |
1.28770 |
XAUUSD
.webp)
Gold price on the 1-hour period is below the first resistance area at 2749.50, trying to move down towards the pivot area at 2737.10 to the first support area at 2728.30. Meanwhile, the RSI indicator is above the pivot area, so the price of gold has the potential to move up first before a correction.
Suggest: Sell 2753.00 TP1 2748.00 TP2 2743.00 SL 2758.00|
PREVIOUS RANGE |
||||||
|
OPEN |
HIGH |
LOW |
CLOSE |
PREV.CLOSE |
CHANGE |
%CHANGE |
|
2735.33 |
2745.92 |
2724.71 |
2742.52 |
2744.80 |
-2.28 |
-0.08% |
|
DAILY PIVOT POINT |
||||||
|
R3 |
R2 |
R1 |
PIVOT |
S1 |
S2 |
S3 |
|
2770.70 |
2758.30 |
2749.50 |
2737.10 |
2728.30 |
2715.90 |
2707.10 |
CLSK (OIL)
.webp)
Oil prices in the 1-hour period are above the first support area at 66.93, there is a chance to move up to the pivot area at 67.95 to the first resistance area at 69.00. Meanwhile, the RSI indicator is below the pivot area, so oil prices have the potential to move down first before rebounding.
Suggest: Buy 67.30 TP1 67.80 TP2 68.30 SL 66.80|
PREVIOUS RANGE |
||||||
|
OPEN |
HIGH |
LOW |
CLOSE |
PREV.CLOSE |
CHANGE |
%CHANGE |
|
68.97 |
68.97 |
66.90 |
67.97 |
71.60 |
-3.63 |
-5.07% |
|
DAILY PIVOT POINT |
||||||
|
R3 |
R2 |
R1 |
PIVOT |
S1 |
S2 |
S3 |
|
71.07 |
70.02 |
69.00 |
67.95 |
66.93 |
65.88 |
64.86 |
So, that's the explanation of "Technical Daily Analysis: October 29, 2024 – US Dollar Weakens". Also read our other articles, such as an explanation of how to buy cryptocurrencies, only in the GIC Journal. Don't forget to practice your trading skills by getting the Scalping Ebook guidebook. Make sure, download GIC Mobile Apps on the Google Play Store.


