 Last:
Last: 
USDJPY
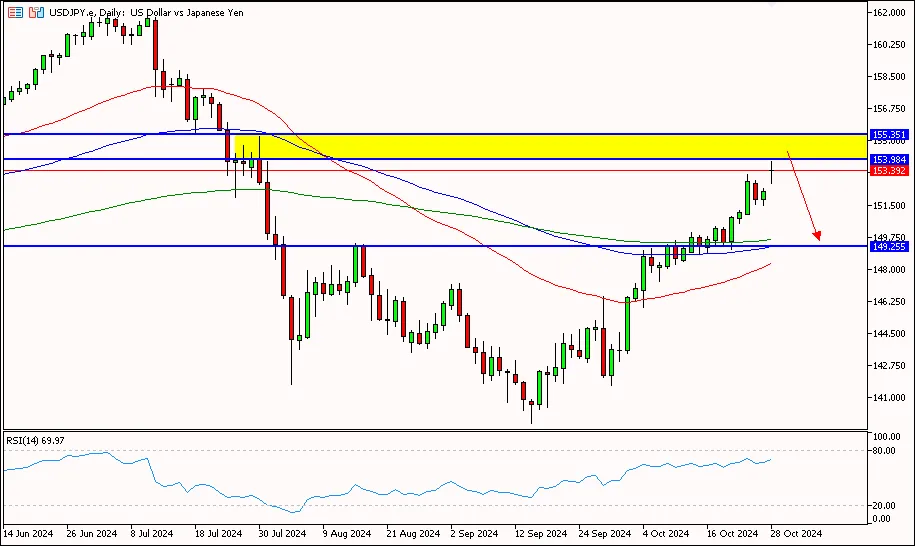
USD/JPY on the daily period is above the second resistance area at 152,900, trying to move up towards the third resistance area at 153,420 until it reaches the next resistance area at 154,000. Meanwhile, the RSI indicator is above the pivot area or overbought, so the yen has the potential to move up first before correcting to the bwah.
Suggest: Sell 153.500 TP1 153.000 TP2 152.500 SL 154.000|
PREVIOUS RANGE |
||||||
|
OPEN |
HIGH |
LOW |
CLOSE |
PREV.CLOSE |
CHANGE |
%CHANGE |
|
151.822 |
152.377 |
151.450 |
152.230 |
151.820 |
0.410 |
0.27% |
|
DAILY PIVOT POINT |
||||||
|
R3 |
R2 |
R1 |
PIVOT |
S1 |
S2 |
S3 |
|
153.420 |
152.900 |
152.490 |
151.970 |
151.560 |
151.040 |
150.640 |
XAUUSD
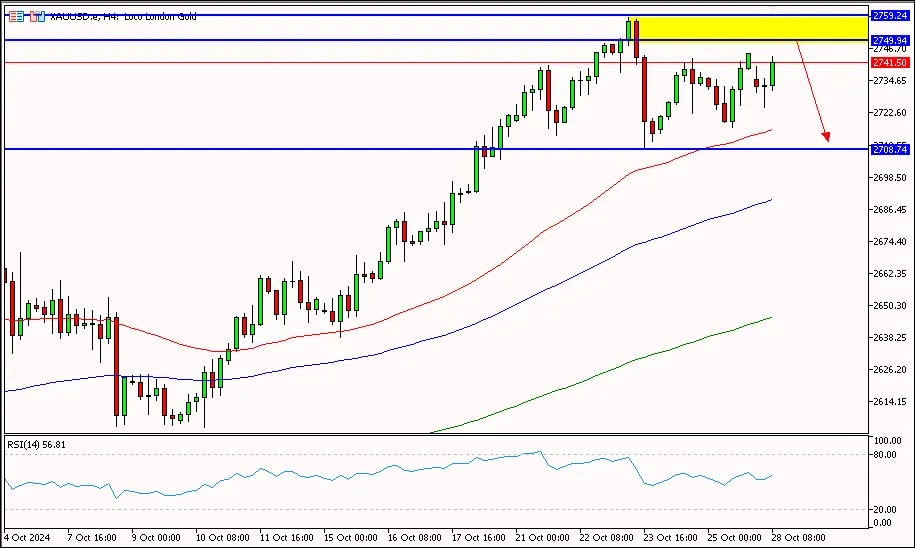
Gold prices in the 4-hour period are above the pivot area at 2735.60, trying to move up towards the first resistance area at 2754.20 to the second resistance area at 2763.60. Meanwhile, the RSI indicator is above the pivot area or heading towards the overbought area, so the price of gold has the potential to move up first before the correction falls.
Suggest: Sell 2745.00 TP1 2735.00 TP2 2725.00 SL 2755.00|
PREVIOUS RANGE |
||||||
|
OPEN |
HIGH |
LOW |
CLOSE |
PREV.CLOSE |
CHANGE |
%CHANGE |
|
2735.53 |
2745.05 |
2717.03 |
2744.80 |
2736.01 |
8.79 |
0.32% |
|
DAILY PIVOT POINT |
||||||
|
R3 |
R2 |
R1 |
PIVOT |
S1 |
S2 |
S3 |
|
2782.20 |
2763.60 |
2754.20 |
2735.60 |
2726.20 |
2707.60 |
2698.10 |
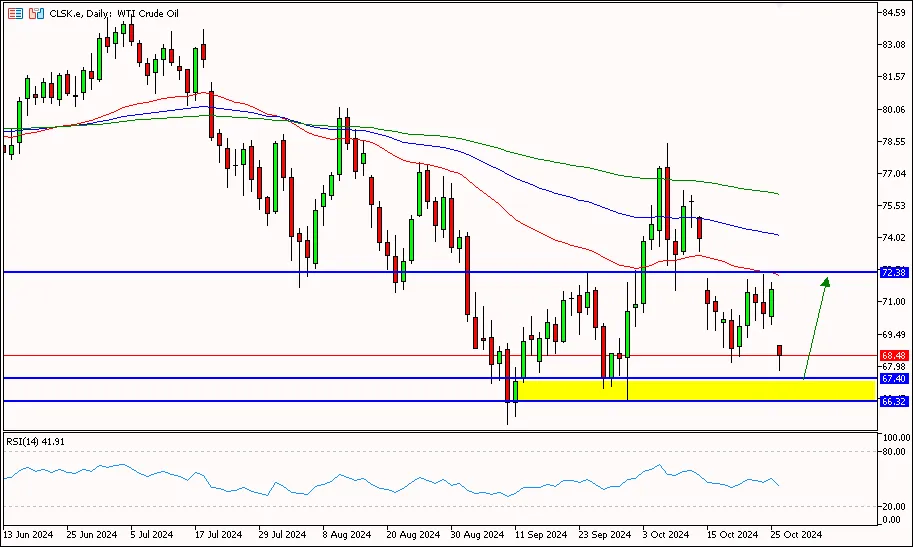
CLSK (OIL)
|
PREVIOUS RANGE |
||||||
|
OPEN |
HIGH |
LOW |
CLOSE |
PREV.CLOSE |
CHANGE |
%CHANGE |
|
70.32 |
71.90 |
69.95 |
71.60 |
70.48 |
1.12 |
1.59% |
|
DAILY PIVOT POINT |
||||||
|
R3 |
R2 |
R1 |
PIVOT |
S1 |
S2 |
S3 |
|
74.30 |
73.10 |
72.35 |
71.15 |
70.40 |
69.20 |
68.45 |
So, that's the explanation of "Technical Daily Analysis: October 28, 2024 – Safe Haven Assets Correction". Also read our other articles, such as an explanation of how to buy cryptocurrencies, only in the GIC Journal. Don't forget to practice your trading skills by getting the Scalping Ebook guidebook. Make sure, download GIC Mobile Apps on the Google Play Store.


