 Last:
Last: 
The following is a daily technical analysis, October 11, 2024. The data and analysis in this bulletin can be used on a wide scale for your trading. However, please note that GICTrade and the data provider are not responsible for your trading results.
Here we will inform you of the forecast of price movements in Forex and Commodities which are equipped with calculations of Pivot point levels, Resistance and Support.
GBPUSD
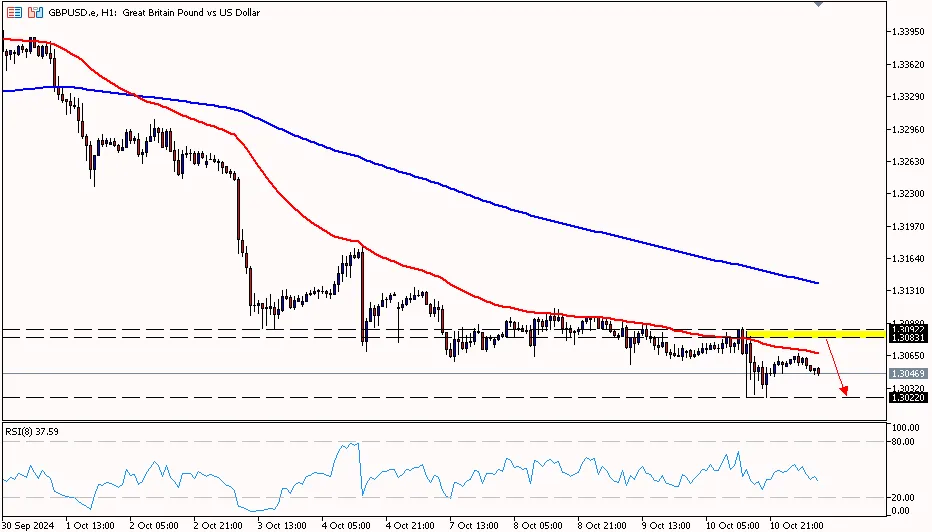
GBP/USD on the 1-hour period is below the pivot area at 1.30610, trying to move down to the first support area at 1.30280 to the second support area at 1.29890. While the RSI indicator is below the pivot area, so the pound has the potential to move down further.
Suggest: Sell 1.30610 TP1 1.30280 TP2 1.29890 SL 1.31000
XAUUSD
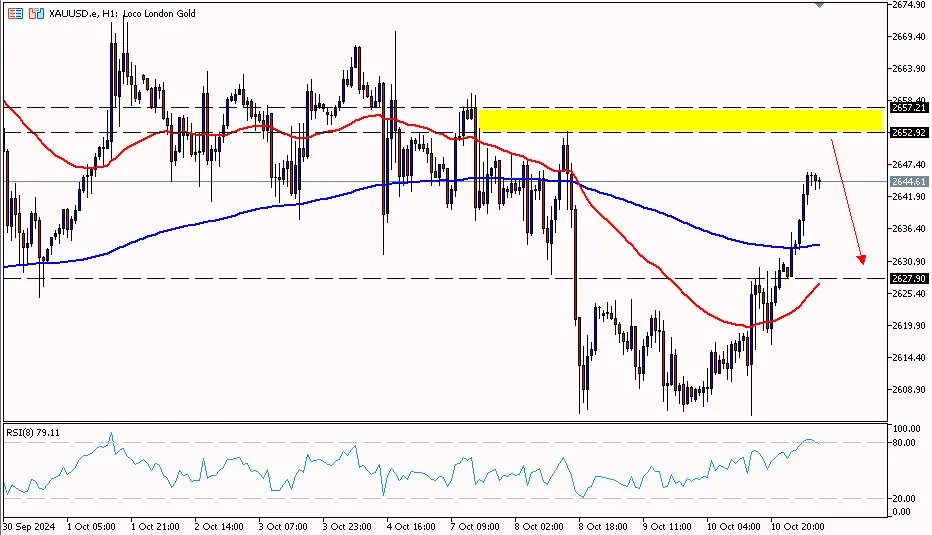
The price of gold in the 1-hour period is above the first resistance area at 2632.20, trying to move up towards the second resistance area at 2645.20 to the third resistance area at 2659.10. While the RSI indicator is above the overbought pivot area, so the price of gold has the potential to move up further before declining.
Suggest: Sell 2650.00 TP1 2645.00 TP2 2635.00 SL 2655.00
CLSK (OIL)
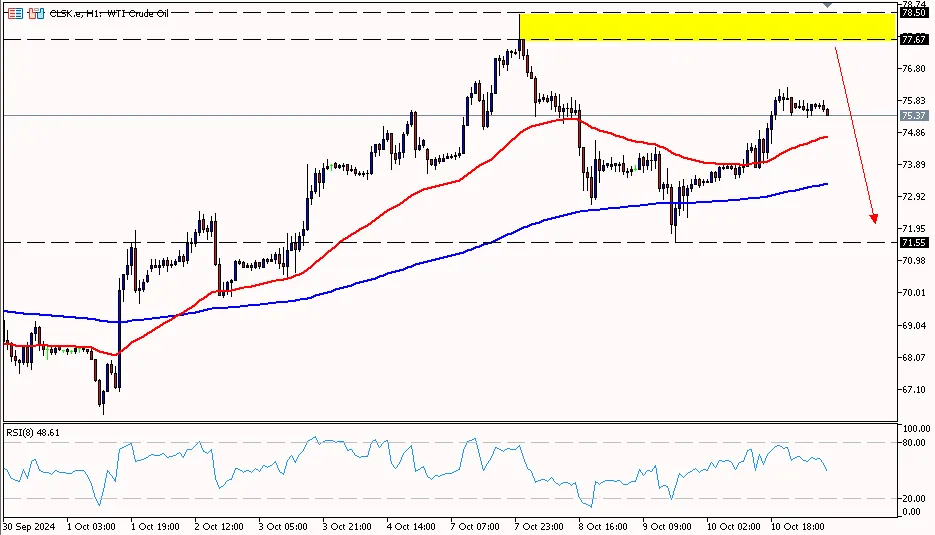
Oil prices in the 1-hour period are below the first resistance area at 76.71, with the potential to move down to the pivot area at 74.98 to the first support area at 73.74. Meanwhile, the RSI indicator is below the pivot area, so oil prices have the potential to move down further.
Suggest: Sell 76.00 TP1 75.50 TP2 75.00 SL 76.50
Well, that's the explanation of "Daily Technical Analysis: October 11, 2024 - US Dollar Strengthens". Also read our other articles, such as an explanation of how to buy cryptocurrency, only in the GIC Journal. Don't forget to train your trading skills by getting the Ebook Scalping guidebook. Make sure to download the GIC Mobile Apps on the Google Play Store.
GBPUSD
GBP/USD on the 1-hour period is below the pivot area at 1.30610, trying to move down to the first support area at 1.30280 to the second support area at 1.29890. While the RSI indicator is below the pivot area, so the pound has the potential to move down further.
Suggest: Sell 1.30610 TP1 1.30280 TP2 1.29890 SL 1.31000
|
PREVIOUS RANGE |
||||||
|
OPEN |
HIGH |
LOW |
CLOSE |
PREV.CLOSE |
CHANGE |
%CHANGE |
|
1.30684 |
1.30938 |
1.30220 |
1.30587 |
1.30721 |
-0.00134 |
-0.10% |
|
DAILY PIVOT POINT |
||||||
|
R3 |
R2 |
R1 |
PIVOT |
S1 |
S2 |
S3 |
|
1.31720 |
1.31330 |
1.31000 |
1.30610 |
1.30280 |
1.29890 |
1.29560 |
XAUUSD
The price of gold in the 1-hour period is above the first resistance area at 2632.20, trying to move up towards the second resistance area at 2645.20 to the third resistance area at 2659.10. While the RSI indicator is above the overbought pivot area, so the price of gold has the potential to move up further before declining.
Suggest: Sell 2650.00 TP1 2645.00 TP2 2635.00 SL 2655.00
|
PREVIOUS RANGE |
||||||
|
OPEN |
HIGH |
LOW |
CLOSE |
PREV.CLOSE |
CHANGE |
%CHANGE |
|
2607.15 |
2631.38 |
2604.44 |
2630.24 |
2607.69 |
22.55 |
0.86% |
|
DAILY PIVOT POINT |
||||||
|
R3 |
R2 |
R1 |
PIVOT |
S1 |
S2 |
S3 |
|
2659.10 |
2645.20 |
2632.20 |
2618.30 |
2605.20 |
2591.40 |
2578.30 |
CLSK (OIL)
Oil prices in the 1-hour period are below the first resistance area at 76.71, with the potential to move down to the pivot area at 74.98 to the first support area at 73.74. Meanwhile, the RSI indicator is below the pivot area, so oil prices have the potential to move down further.
Suggest: Sell 76.00 TP1 75.50 TP2 75.00 SL 76.50
|
PREVIOUS RANGE |
||||||
|
OPEN |
HIGH |
LOW |
CLOSE |
PREV.CLOSE |
CHANGE |
%CHANGE |
|
73.35 |
76.22 |
73.25 |
75.47 |
73.25 |
2.22 |
3.03% |
|
DAILY PIVOT POINT |
||||||
|
R3 |
R2 |
R1 |
PIVOT |
S1 |
S2 |
S3 |
|
79.68 |
77.95 |
76.71 |
74.98 |
73.74 |
72.01 |
70.77 |
Well, that's the explanation of "Daily Technical Analysis: October 11, 2024 - US Dollar Strengthens". Also read our other articles, such as an explanation of how to buy cryptocurrency, only in the GIC Journal. Don't forget to train your trading skills by getting the Ebook Scalping guidebook. Make sure to download the GIC Mobile Apps on the Google Play Store.


