 Last:
Last: 
The following is a daily technical analysis, November 11, 2024. The data and analysis contained in this bulletin can be used on a wide scale for your trading. However, it is important to note that GICTrade and its data providers are not responsible for your trading results.
USDJPY
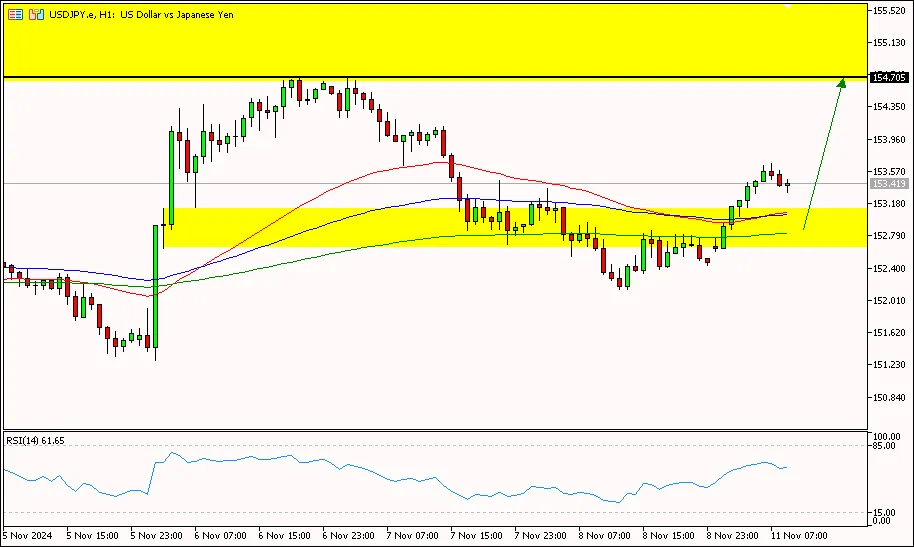
USD/JPY on the 1-hour period is above the first resistance area at 153,300, trying to move up towards the second resistance area at 153,950 to the third resistance area at 154,530. While the RSI indicator is above the pivot area so that the yen has the potential to move up further.
Suggest: Buy 153.000 TP1 154.000 TP2 154.500 SL 152.500|
PREVIOUS RANGE |
||||||
|
OPEN |
HIGH |
LOW |
CLOSE |
PREV.CLOSE |
CHANGE |
%CHANGE |
|
152.909 |
153.367 |
152.141 |
152.474 |
152.897 |
-0.423 |
-0.28% |
|
DAILY PIVOT POINT |
||||||
|
R3 |
R2 |
R1 |
PIVOT |
S1 |
S2 |
S3 |
|
154.530 |
153.950 |
153.300 |
152.720 |
152.070 |
151.490 |
150.850 |
XAUUSD
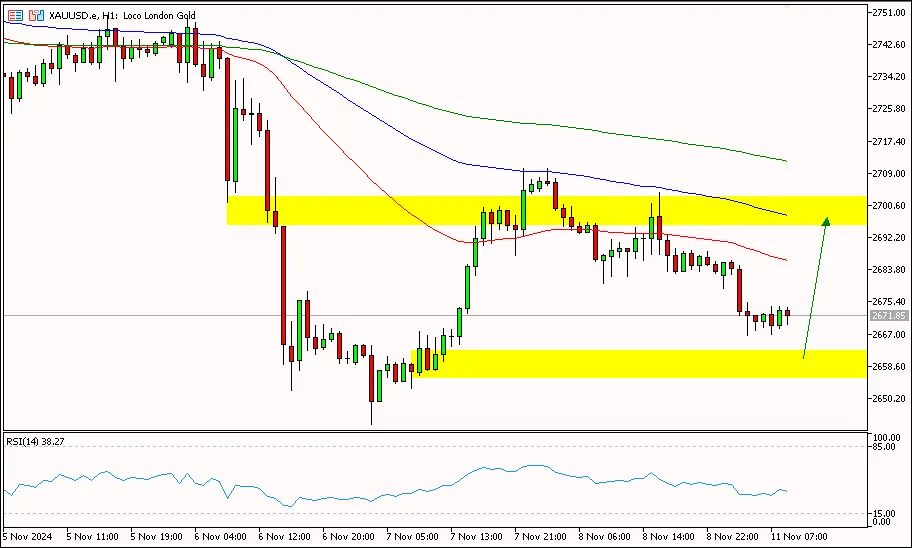
The price of gold in the 1-hour period is below the first support area at 2679.20, trying to move down towards the second support area at 2664.70 to the third support area at 2649.20. While the RSI indicator is below the pivot area, so the price of gold has the potential to move down further.
Suggest: Sell 2680.00 TP1 2665.00 TP2 2655.00 SL 2690.00|
PREVIOUS RANGE |
||||||
|
OPEN |
HIGH |
LOW |
CLOSE |
PREV.CLOSE |
CHANGE |
%CHANGE |
|
2704.93 |
2710.37 |
2680.29 |
2683.45 |
2706.14 |
-22.69 |
-0.84% |
|
DAILY PIVOT POINT |
||||||
|
R3 |
R2 |
R1 |
PIVOT |
S1 |
S2 |
S3 |
|
2739.40 |
2724.90 |
2709.30 |
2694.80 |
2679.20 |
2664.70 |
2649.20 |
CLSK (OIL)
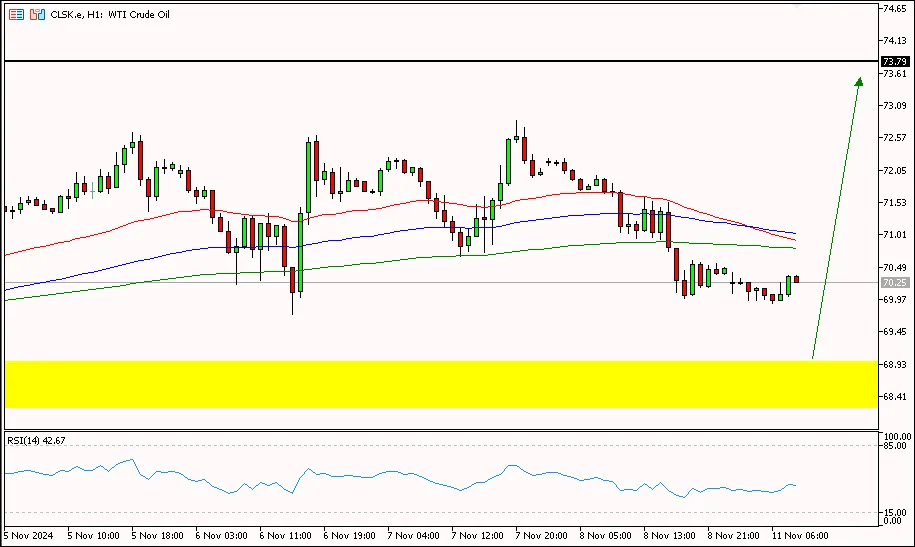
Oil prices in the 1-hour period are below the pivot area at 70.89, potentially moving down to the first support area at 69.55 to the second support area at 68.64. While the RSI indicator is below the pivot area, so oil prices have the potential to move down further.
Suggest: Sell 71.00 TP1 70.00 TP2 69.50 SL 71.50|
PREVIOUS RANGE |
||||||
|
OPEN |
HIGH |
LOW |
CLOSE |
PREV.CLOSE |
CHANGE |
%CHANGE |
|
72.19 |
72.23 |
69.98 |
70.47 |
72.01 |
-1.54 |
-2.14% |
|
DAILY PIVOT POINT |
||||||
|
R3 |
R2 |
R1 |
PIVOT |
S1 |
S2 |
S3 |
|
74.05 |
73.14 |
71.80 |
70.89 |
69.55 |
68.64 |
67.30 |
Well, that's the explanation of "Daily Technical Analysis: November 11, 2024 - US Dollar Still Strengthening". Also read our other articles, such as an explanation of how to buy cryptocurrency, only in the GIC Journal. Don't forget to train your trading skills by getting the Ebook Scalping guidebook. Make sure to download the GIC Mobile Apps on the Google Play Store.


