 Last:
Last: 
Here is the daily technical analysis for May 28, 2024. The data and analysis presented in this bulletin can be broadly applied to your trading. However, it is important to note that GICTrade and the data providers are not responsible for your trading results.
We will now provide a forecast of price movements in Forex and Commodities, complete with Pivot point calculations, Resistance, and Support levels.
USDJPY
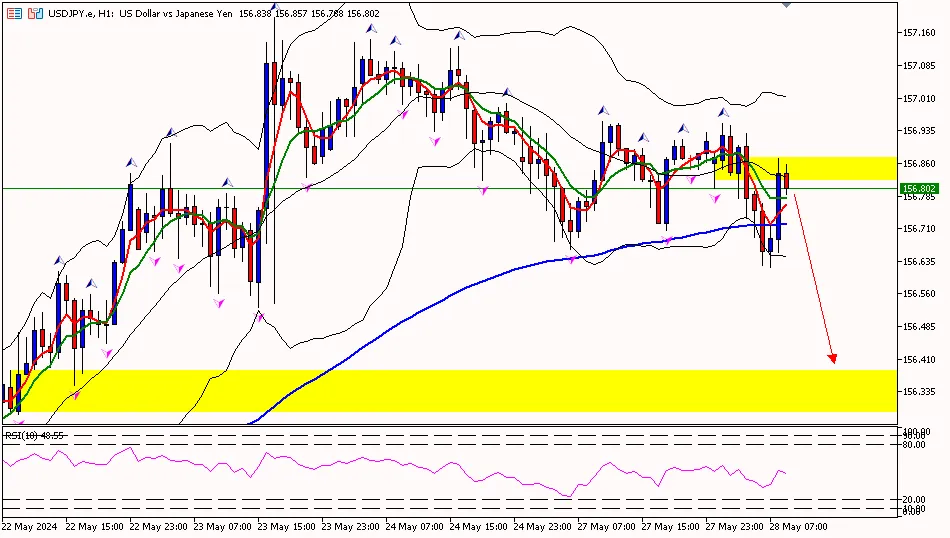
USD/JPY on the 1-hour timeframe is below the first resistance area at 157.040, attempting to move down towards the pivot area at 156.850 and then to the first support area at 156.730. Meanwhile, the RSI indicator is above the pivot area, suggesting that the yen has the potential to move higher first towards the first resistance before continuing its downward trend.
Suggest: Sell 157.040 TP1 156.800 TP2 156.600 SL 157.200
USDJPY
USD/JPY on the 1-hour timeframe is below the first resistance area at 157.040, attempting to move down towards the pivot area at 156.850 and then to the first support area at 156.730. Meanwhile, the RSI indicator is above the pivot area, suggesting that the yen has the potential to move higher first towards the first resistance before continuing its downward trend.
Suggest: Sell 157.040 TP1 156.800 TP2 156.600 SL 157.200
|
PREVIOUS RANGE |
||||||
|
OPEN |
HIGH |
LOW |
CLOSE |
PREV.CLOSE |
CHANGE |
%CHANGE |
|
156.874 |
156.966 |
156.662 |
156.911 |
156.934 |
-0.023 |
-0.01% |
|
DAILY PIVOT POINT |
||||||
|
R3 |
R2 |
R1 |
PIVOT |
S1 |
S2 |
S3 |
|
157.340 |
157.150 |
157.040 |
156.850 |
156.730 |
156.550 |
156.430 |
XAUUSD (LOCO LONDON GOLD)
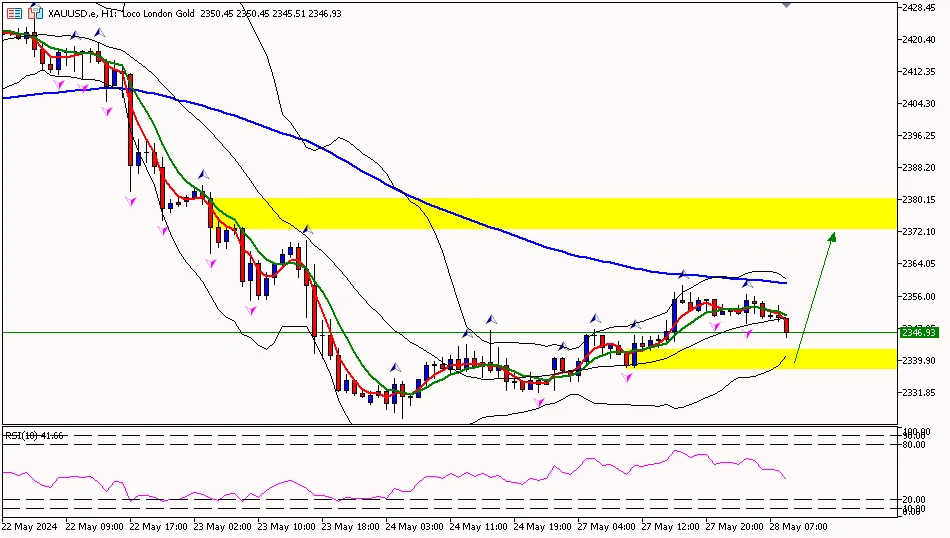
Gold prices on the 1-hour timeframe are at the pivot area at 2345.00, attempting to move down towards the first support area at 2331.50 and then to the second support area at 2318.80. Meanwhile, the RSI indicator is below the pivot area, indicating that gold prices have the potential to move lower further before rebounding.
Suggest: Buy 2331.50 TP1 2336.50 TP2 2346.00 SL 2326.50
|
PREVIOUS RANGE |
||||||
|
OPEN |
HIGH |
LOW |
CLOSE |
PREV.CLOSE |
CHANGE |
%CHANGE |
|
2337.78 |
2358.53 |
2332.29 |
2351.21 |
2334.59 |
16.62 |
0.71% |
|
DAILY PIVOT POINT |
||||||
|
R3 |
R2 |
R1 |
PIVOT |
S1 |
S2 |
S3 |
|
2384.00 |
2371.20 |
2357.70 |
2345.00 |
2331.50 |
2318.80 |
2305.20 |
CLSK (OIL)
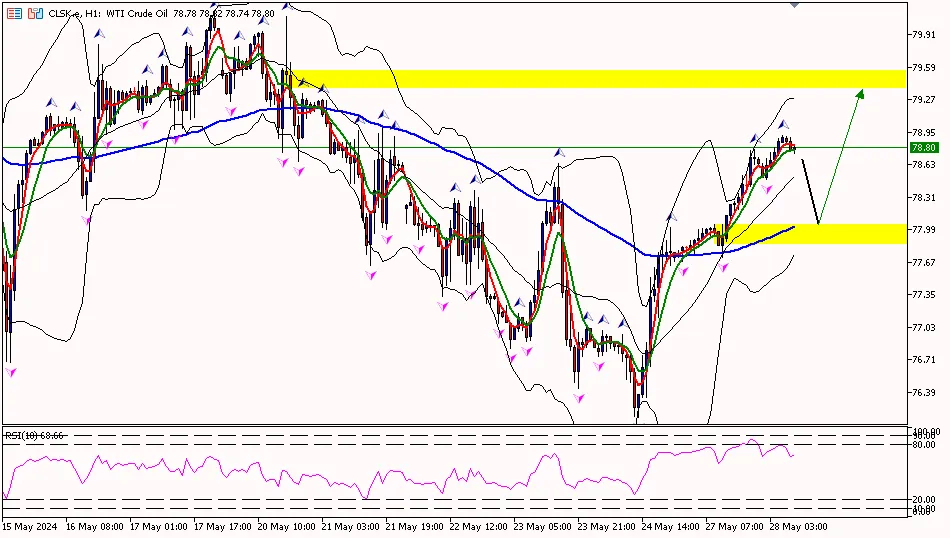
Oil prices on the 1-hour timeframe are above the pivot area at 78.37, with the potential to move up towards the first resistance area at 79.06 and then to the second resistance area at 79.47. Meanwhile, the RSI indicator is above the pivot area, suggesting that oil prices have the potential to continue rising.
Suggest: Buy 78.37 TP1 78.80 TP2 79.50 SL 77.80
|
PREVIOUS RANGE |
||||||
|
OPEN |
HIGH |
LOW |
CLOSE |
PREV.CLOSE |
CHANGE |
%CHANGE |
|
77.79 |
78.78 |
77.68 |
78.64 |
77.74 |
0.90 |
1.16% |
|
DAILY PIVOT POINT |
||||||
|
R3 |
R2 |
R1 |
PIVOT |
S1 |
S2 |
S3 |
|
80.16 |
79.47 |
79.06 |
78.37 |
77.96 |
77.27 |
76.86 |
Well, that concludes the explanation of “Daily Technical Analysis: May 28, 2024 – US Dollar Corrects.” Also, check out our other articles, such as the guide on how to buy cryptocurrency, only at Jurnal GIC. Don’t forget to enhance your trading skills by obtaining the Ebook Scalping guide. Make sure to download the GIC Mobile Apps from the Google Play Store.


