 Last:
Last: 
Here is the daily technical analysis for May 22, 2024. The data and analysis presented in this bulletin can be broadly applied to your trading. However, it is important to note that GICTrade and the data providers are not responsible for your trading results.
We will now provide a forecast of price movements in Forex and Commodities, complete with Pivot point calculations, Resistance, and Support levels.
GBPUSD
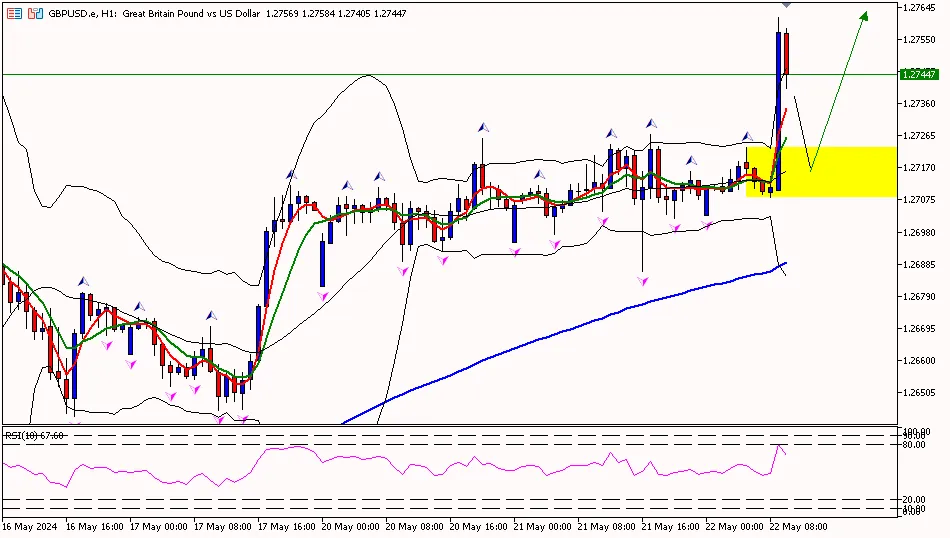
GBP/USD on the 1-hour timeframe is above the first resistance area at 1.27220, attempting to move up towards the second resistance area at 1.27450 and then to the third resistance area at 1.27620. Meanwhile, the RSI indicator is above the pivot area, suggesting that the pound sterling has the potential to continue rising.
Suggest: Buy 1.27220 TP1 1.27450 TP2 1.27620 SL 1.27000
GBPUSD
GBP/USD on the 1-hour timeframe is above the first resistance area at 1.27220, attempting to move up towards the second resistance area at 1.27450 and then to the third resistance area at 1.27620. Meanwhile, the RSI indicator is above the pivot area, suggesting that the pound sterling has the potential to continue rising.
Suggest: Buy 1.27220 TP1 1.27450 TP2 1.27620 SL 1.27000
|
PREVIOUS RANGE |
||||||
|
OPEN |
HIGH |
LOW |
CLOSE |
PREV.CLOSE |
CHANGE |
%CHANGE |
|
1.26950 |
1.27269 |
1.26863 |
1.27088 |
1.27052 |
0.00036 |
0.03% |
|
DAILY PIVOT POINT |
||||||
|
R3 |
R2 |
R1 |
PIVOT |
S1 |
S2 |
S3 |
|
1.27620 |
1.27450 |
1.27220 |
1.27040 |
1.26810 |
1.26630 |
1.26400 |
XAUUSD (LOCO LONDON GOLD)
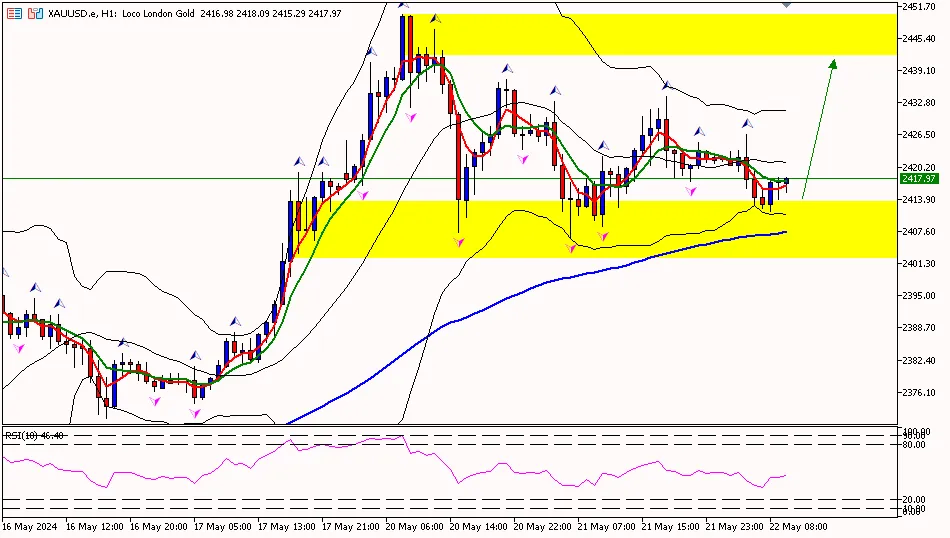
Gold prices on the 1-hour timeframe are below the pivot area at 2422.20, attempting to move down towards the first support area at 2410.50 and then to the second support area at 2394.50. Meanwhile, the RSI indicator is below the pivot area, indicating that gold prices have the potential to decline further.
Suggest: Sell 2422.00 TP1 2417.00 TP2 2407.00 SL 2427.00
|
PREVIOUS RANGE |
||||||
|
OPEN |
HIGH |
LOW |
CLOSE |
PREV.CLOSE |
CHANGE |
%CHANGE |
|
2426.74 |
2433.93 |
2406.24 |
2421.71 |
2426.45 |
-4.74 |
-0.20% |
|
DAILY PIVOT POINT |
||||||
|
R3 |
R2 |
R1 |
PIVOT |
S1 |
S2 |
S3 |
|
2465.90 |
2449.90 |
2438.20 |
2422.20 |
2410.50 |
2394.50 |
2382.80 |
CLSK (OIL)
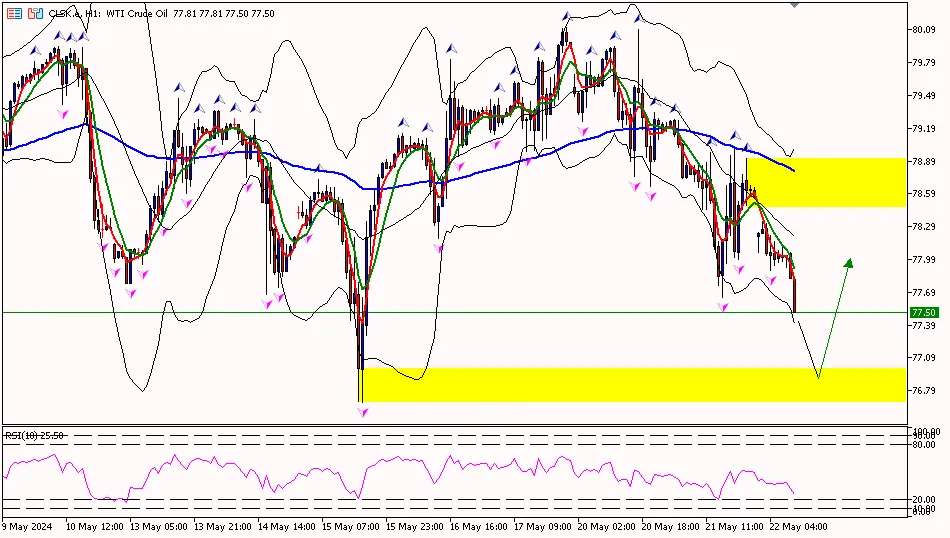
Oil prices on the 1-hour timeframe are below the first support area at 77.71, with the potential to move down to the second support area at 76.86 and then to the third support area at 76.08. Meanwhile, the RSI indicator is below the pivot area, suggesting that oil prices may decline further before rebounding.
Suggest: Buy 76.86 TP1 77.30 TP2 77.70 SL 76.50
|
PREVIOUS RANGE |
||||||
|
OPEN |
HIGH |
LOW |
CLOSE |
PREV.CLOSE |
CHANGE |
%CHANGE |
|
79.19 |
79.27 |
77.64 |
78.57 |
79.16 |
-0.59 |
-0.75% |
|
DAILY PIVOT POINT |
||||||
|
R3 |
R2 |
R1 |
PIVOT |
S1 |
S2 |
S3 |
|
80.97 |
80.12 |
79.34 |
78.49 |
77.71 |
76.86 |
76.08 |
Well, that concludes the explanation of “Daily Technical Analysis: May 22, 2024 – Gold Prices Likely to Decline.” Also, check out our other articles, such as the guide on how to buy cryptocurrency, only at Jurnal GIC. Don’t forget to enhance your trading skills by obtaining the Ebook Scalping guide. Make sure to download the GIC Mobile Apps from the Google Play Store.


