 Last:
Last: 
Here is the daily technical analysis for May 21, 2024. The data and analysis presented in this bulletin can be broadly applied to your trading. However, it is important to note that GICTrade and the data providers are not responsible for your trading results.
We will now provide a forecast of price movements in Forex and Commodities, complete with Pivot point calculations, Resistance, and Support levels.
EURUSD
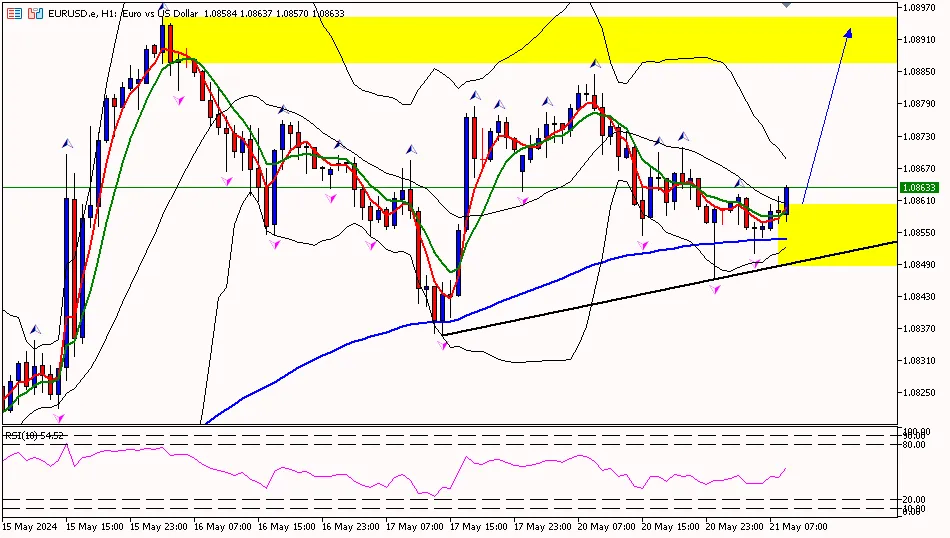
EUR/USD on the 1-hour timeframe is above the first support area at 1.08470, attempting to move up towards the pivot area at 1.08660 and then to the first resistance area at 1.08780. Meanwhile, the RSI indicator is above the pivot area, suggesting that the euro has the potential to rise.
Suggest: Buy 1.08470 TP1 1.08660 TP2 1.08780 SL 1.08300
EURUSD
EUR/USD on the 1-hour timeframe is above the first support area at 1.08470, attempting to move up towards the pivot area at 1.08660 and then to the first resistance area at 1.08780. Meanwhile, the RSI indicator is above the pivot area, suggesting that the euro has the potential to rise.
Suggest: Buy 1.08470 TP1 1.08660 TP2 1.08780 SL 1.08300
|
PREVIOUS RANGE |
||||||
|
OPEN |
HIGH |
LOW |
CLOSE |
PREV.CLOSE |
CHANGE |
%CHANGE |
|
1.08663 |
1.08846 |
1.08544 |
1.08568 |
1.08704 |
-0.00136 |
-0.13% |
|
DAILY PIVOT POINT |
||||||
|
R3 |
R2 |
R1 |
PIVOT |
S1 |
S2 |
S3 |
|
1.09080 |
1.08960 |
1.08780 |
1.08660 |
1.08470 |
1.08360 |
1.08170 |
XAUUSD (LOCO LONDON GOLD)
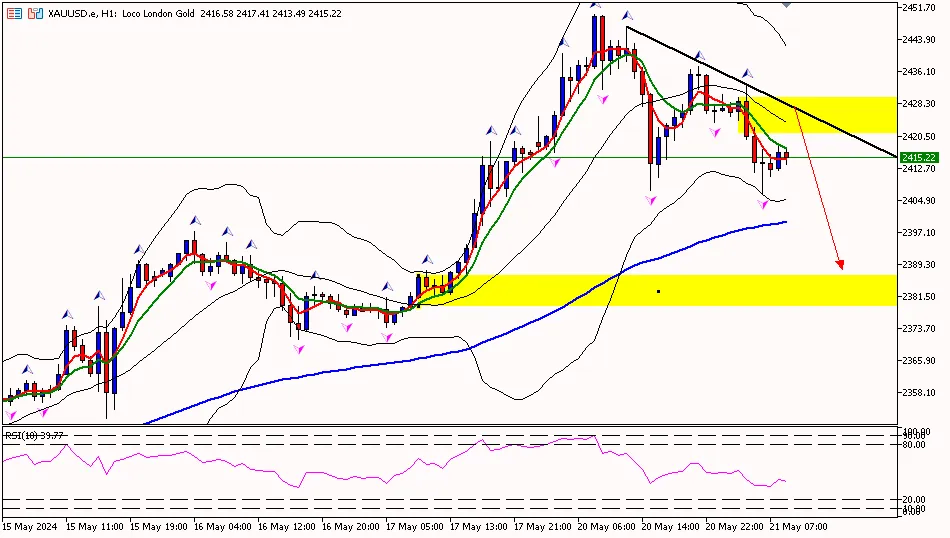
Gold prices on the 1-hour timeframe are below the pivot area at 2425.70, attempting to move down towards the first support area at 2401.40 and then to the second support area at 2383.00. Meanwhile, the RSI indicator is below the pivot area, indicating that gold prices have the potential to decline further.
Suggest: Sell 2425.00 TP1 2415.00 TP2 2405.00 SL 2430.00
|
PREVIOUS RANGE |
||||||
|
OPEN |
HIGH |
LOW |
CLOSE |
PREV.CLOSE |
CHANGE |
%CHANGE |
|
2418.88 |
2450.03 |
2407.36 |
2426.45 |
2415.89 |
10.56 |
0.44% |
|
DAILY PIVOT POINT |
||||||
|
R3 |
R2 |
R1 |
PIVOT |
S1 |
S2 |
S3 |
|
2486.70 |
2468.40 |
2444.00 |
2425.70 |
2401.40 |
2383.00 |
2358.70 |
CLSK (OIL)
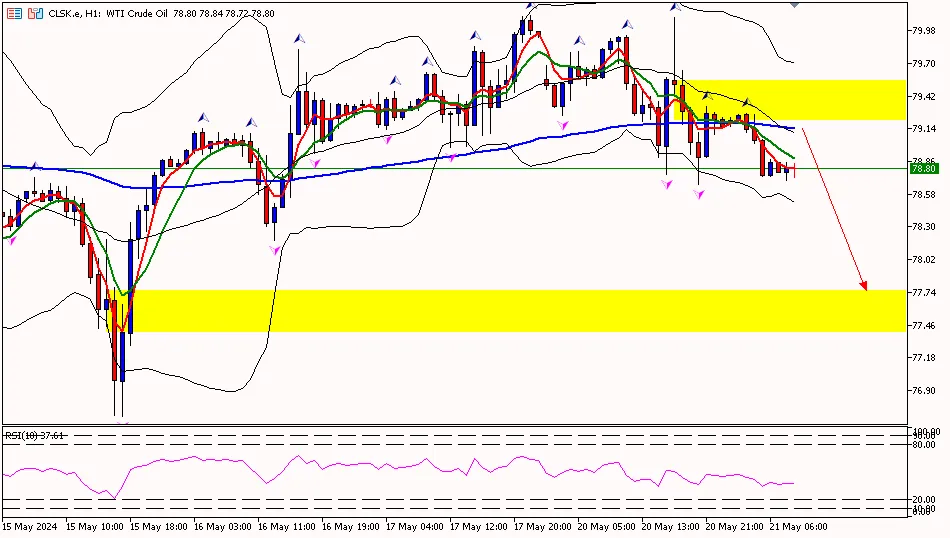
Oil prices on the 1-hour timeframe are below the pivot area at 79.30, with the potential to move down to the first support area at 78.51 and then to the second support area at 77.87. Meanwhile, the RSI indicator is below the pivot area, suggesting that oil prices may decline further.
Suggest: Sell 79.30 TP1 78.50 TP2 78.00 SL 79.80
|
PREVIOUS RANGE |
||||||
|
OPEN |
HIGH |
LOW |
CLOSE |
PREV.CLOSE |
CHANGE |
%CHANGE |
|
79.56 |
80.09 |
78.66 |
79.16 |
79.95 |
-0.79 |
-0.99% |
|
DAILY PIVOT POINT |
||||||
|
R3 |
R2 |
R1 |
PIVOT |
S1 |
S2 |
S3 |
|
81.37 |
80.73 |
79.94 |
79.30 |
78.51 |
77.87 |
77.08 |
Well, that concludes the explanation of “Daily Technical Analysis: May 21, 2024 – Dollar Strengthens Again.” Also, check out our other articles, such as the guide on how to buy cryptocurrency, only at Jurnal GIC. Don’t forget to enhance your trading skills by obtaining the Ebook Scalping guide. Make sure to download the GIC Mobile Apps from the Google Play Store.


