 Last:
Last: 
Here is the daily technical analysis for May 20, 2024. The data and analysis presented in this bulletin can be broadly applied to your trading. However, it is important to note that GICTrade and the data providers are not responsible for your trading results.
We will now provide a forecast of price movements in Forex and Commodities, complete with Pivot point calculations, Resistance, and Support levels.
AUDUSD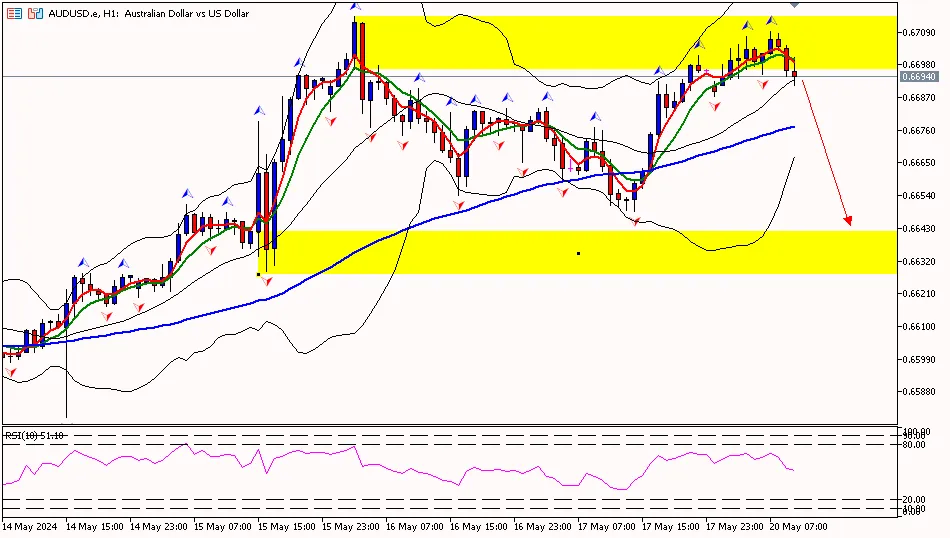
AUD/USD on the 1-hour timeframe is below the first resistance area at 0.67130, attempting to move down to the pivot area at 0.66810 and then to the first support area at 0.66610. Meanwhile, the RSI indicator is below the pivot area, suggesting that the Aussie has the potential to decline further.
Suggest: Sell 0.67000 TP1 0.66800 TP2 0.66600 SL 0.67200
|
PREVIOUS RANGE |
||||||
|
OPEN |
HIGH |
LOW |
CLOSE |
PREV.CLOSE |
CHANGE |
%CHANGE |
|
0.66781 |
0.67011 |
0.66488 |
0.66961 |
0.66786 |
0.00175 |
0.26% |
|
DAILY PIVOT POINT |
||||||
|
R3 |
R2 |
R1 |
PIVOT |
S1 |
S2 |
S3 |
|
0.67660 |
0.67330 |
0.67130 |
0.66810 |
0.66610 |
0.66290 |
0.66090 |
XAUUSD (LOCO LONDON GOLD)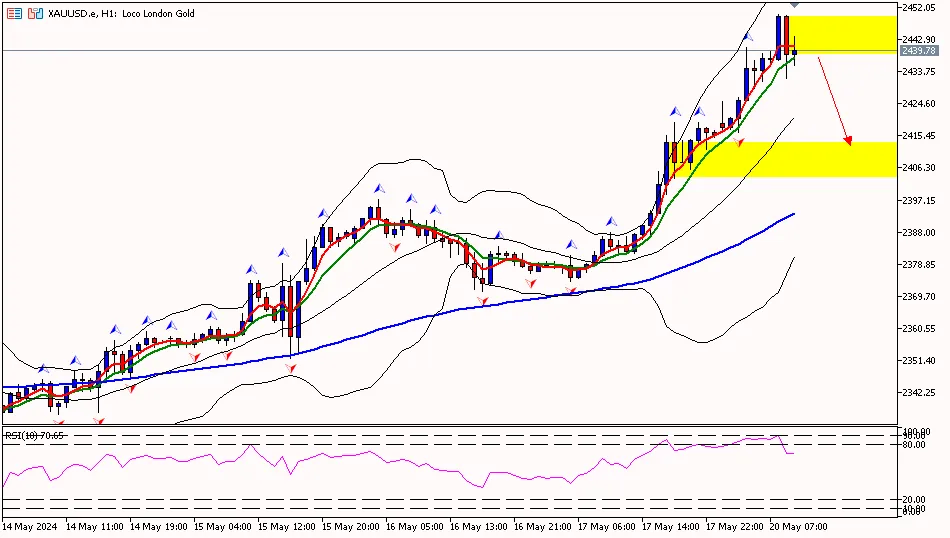
Gold prices on the 1-hour timeframe are below the second resistance area at 2441.70, attempting to move down to the first resistance area at 2419.00 and then to the pivot area at 2396.50. Meanwhile, the RSI indicator is above the pivot area, suggesting that gold prices may rise first before a potential downward correction.
Suggest: Sell 2442.00 TP1 2432.00 TP2 2425.00 SL 2450.00
|
PREVIOUS RANGE |
||||||
|
OPEN |
HIGH |
LOW |
CLOSE |
PREV.CLOSE |
CHANGE |
%CHANGE |
|
2376.79 |
2419.20 |
2374.00 |
2415.89 |
2377.16 |
38.73 |
1.63% |
|
DAILY PIVOT POINT |
||||||
|
R3 |
R2 |
R1 |
PIVOT |
S1 |
S2 |
S3 |
|
2464.20 |
2441.70 |
2419.00 |
2396.50 |
2373.80 |
2351.30 |
2328.60 |
CLSK (OIL)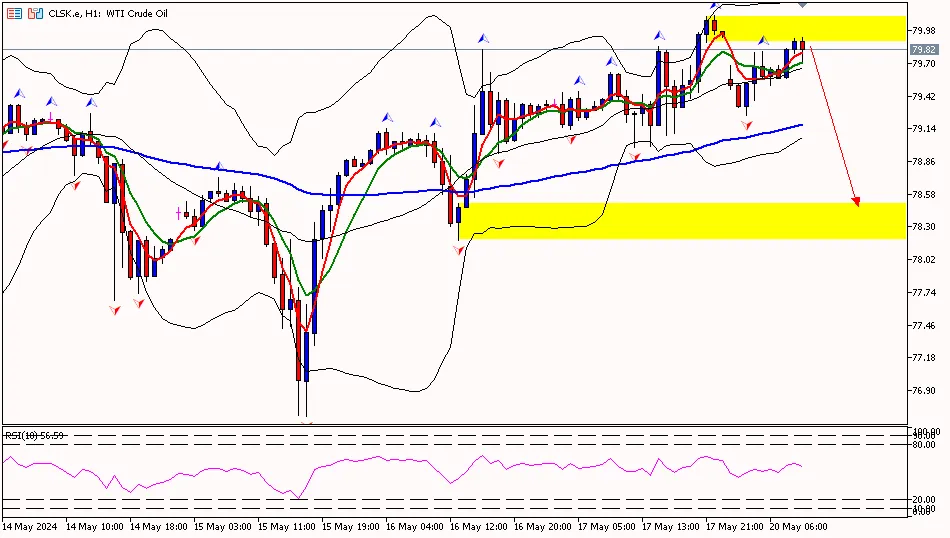
Oil prices on the 1-hour timeframe are below the first resistance area at 80.38, with the potential to move up to the second resistance area at 80.81 and then to the third resistance area at 81.51. Meanwhile, the RSI indicator is above the pivot area, suggesting that oil prices may rise initially.
Suggest: Buy 79.50 TP1 80.00 TP2 80.50 SL 79.00
|
PREVIOUS RANGE |
||||||
|
OPEN |
HIGH |
LOW |
CLOSE |
PREV.CLOSE |
CHANGE |
%CHANGE |
|
79.34 |
80.11 |
78.98 |
79.95 |
79.33 |
0.62 |
0.78% |
|
DAILY PIVOT POINT |
||||||
|
R3 |
R2 |
R1 |
PIVOT |
S1 |
S2 |
S3 |
|
81.51 |
80.81 |
80.38 |
79.68 |
79.25 |
78.55 |
78.12 |
Well, that concludes the explanation of “Daily Technical Analysis: May 20, 2024 – Gold Prices Reach Record High.” Also, check out our other articles, such as the guide on how to buy cryptocurrency, exclusively at Jurnal GIC. Don’t forget to sharpen your trading skills by getting the Ebook Scalping guide. Make sure to download the GIC Mobile Apps from the Google Play Store.


