 Last:
Last: 
Here is the daily technical analysis for May 14, 2024. The data and analysis in this bulletin can be broadly used for your trading. However, please note that GICTrade and the data providers are not responsible for your trading results.
Below is the forecast for price movements in Forex and Commodities, complete with Pivot point, Resistance, and Support levels.
EURUSD
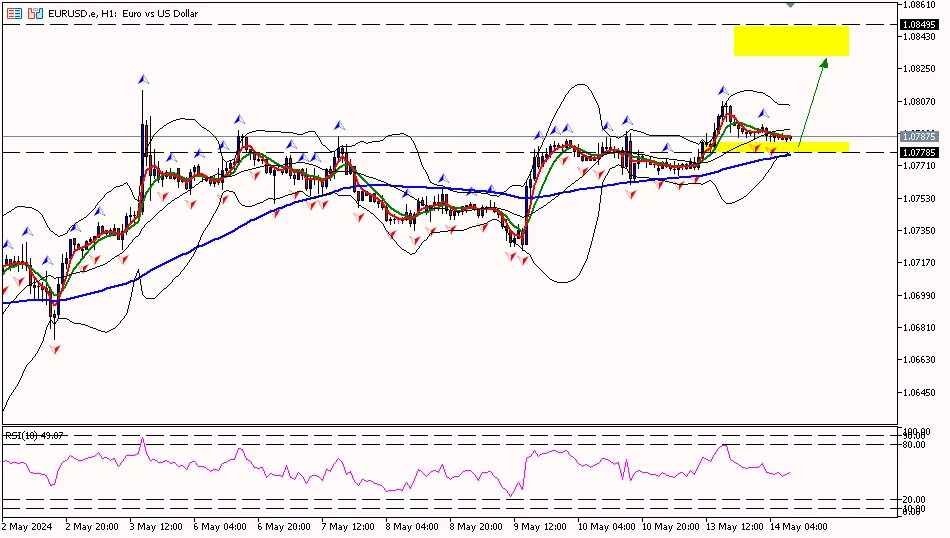 EUR/USD on the 1-hour period is below the first resistance area at 1.08000, attempting to move down to the pivot area at 1.07830 and towards the first support at 1.07590. Meanwhile, the RSI indicator is at the pivot area, suggesting that the euro may move down before continuing its upward trend.
EURUSD
EUR/USD on the 1-hour period is below the first resistance area at 1.08000, attempting to move down to the pivot area at 1.07830 and towards the first support at 1.07590. Meanwhile, the RSI indicator is at the pivot area, suggesting that the euro may move down before continuing its upward trend.Suggest: Buy 1.07800 TP1 1.08000 TP2 1.08240 SL 1.07590
|
PREVIOUS RANGE |
||||||
|
OPEN |
HIGH |
LOW |
CLOSE |
PREV.CLOSE |
CHANGE |
%CHANGE |
|
1.07682 |
1.08069 |
1.07658 |
1.07898 |
1.07717 |
0.00181 |
0.17% |
|
DAILY PIVOT POINT |
||||||
|
R3 |
R2 |
R1 |
PIVOT |
S1 |
S2 |
S3 |
|
1.08410 |
1.08240 |
1.08000 |
1.07830 |
1.07590 |
1.07420 |
1.07180 |
GBPUSD
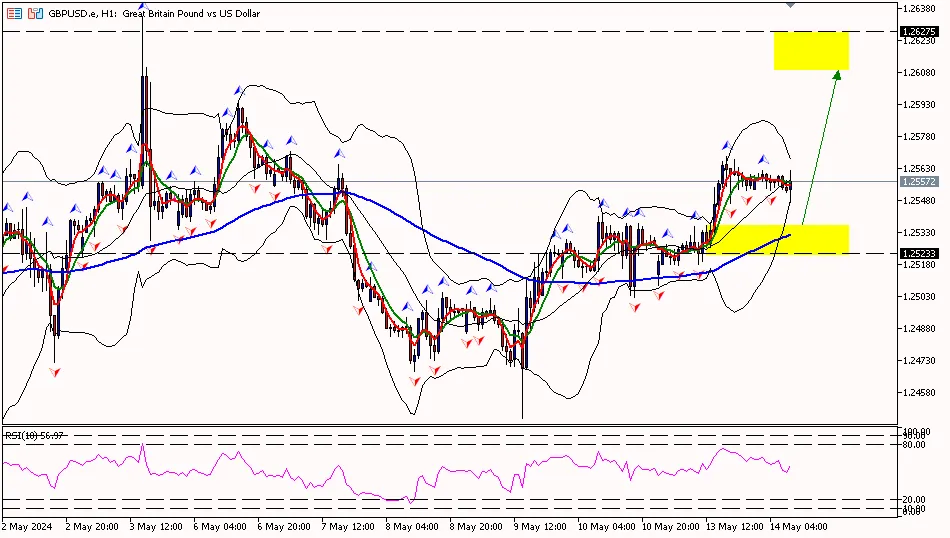
GBP/USD on the 1-hour period is below the first resistance area at 1.25660, attempting to move down to the pivot area at 1.25370 and towards the first support at 1.25050. Meanwhile, the RSI indicator is above the pivot area, suggesting that the pound may move down first before moving further up.
Suggest: Buy 1.25300 TP1 1.25660 TP2 1.25980 SL 1.25000
|
PREVIOUS RANGE |
||||||
|
OPEN |
HIGH |
LOW |
CLOSE |
PREV.CLOSE |
CHANGE |
%CHANGE |
|
1.25132 |
1.25689 |
1.25084 |
1.25590 |
1.25293 |
0.00297 |
0.24% |
|
DAILY PIVOT POINT |
||||||
|
R3 |
R2 |
R1 |
PIVOT |
S1 |
S2 |
S3 |
|
1.26260 |
1.25980 |
1.25660 |
1.25370 |
1.25050 |
1.24770 |
1.24450 |
XAUUSD (LOCO LONDON GOLD)
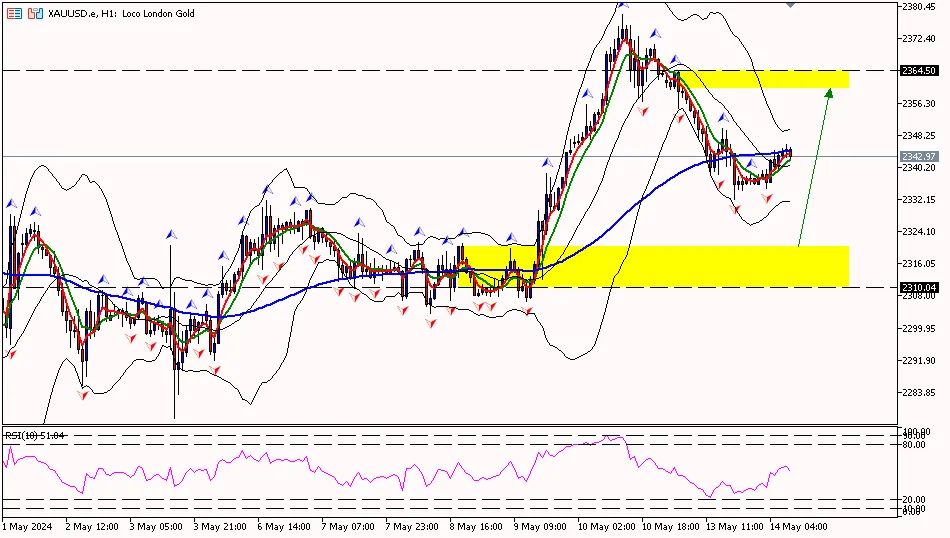
Gold prices on the 1-hour period are below the pivot area at 2348.70, attempting to move down towards the first support area at 2332.90 and the second support area at 2316.30. Meanwhile, the RSI indicator is at the pivot area, suggesting that gold may move down first before rebounding.
Suggest: Buy 2332.90 TP1 2337.90 TP2 2348.700 SL 2327.90
|
PREVIOUS RANGE |
||||||
|
OPEN |
HIGH |
LOW |
CLOSE |
PREV.CLOSE |
CHANGE |
%CHANGE |
|
2361.87 |
2364.50 |
2332.14 |
2336.24 |
2363.76 |
-27.52 |
-1.16% |
|
DAILY PIVOT POINT |
||||||
|
R3 |
R2 |
R1 |
PIVOT |
S1 |
S2 |
S3 |
|
2397.60 |
2381.10 |
2365.30 |
2348.70 |
2332.90 |
2316.30 |
2300.50 |
That concludes the explanation of “Daily Technical Analysis: May 14, 2024 – Inflation Expected to Rise, Dollar Could Correct.” Check out our other articles, such as an explanation of how to buy cryptocurrency, only on Jurnal GIC. Don’t forget to hone your trading skills by getting the Ebook Scalping guide. Make sure to download the GIC Mobile App on Google Play Store.


