 Last:
Last: 
Here is the daily technical analysis for June 26, 2024. The data and analysis in this bulletin can be widely used for your trading activities. However, it should be noted that GICTrade and the data providers are not responsible for the results of your trading.
We will provide you with the forecast of price movements in Forex and Commodities, complete with the calculation of Pivot points, Resistance, and Support levels.
EURUSD
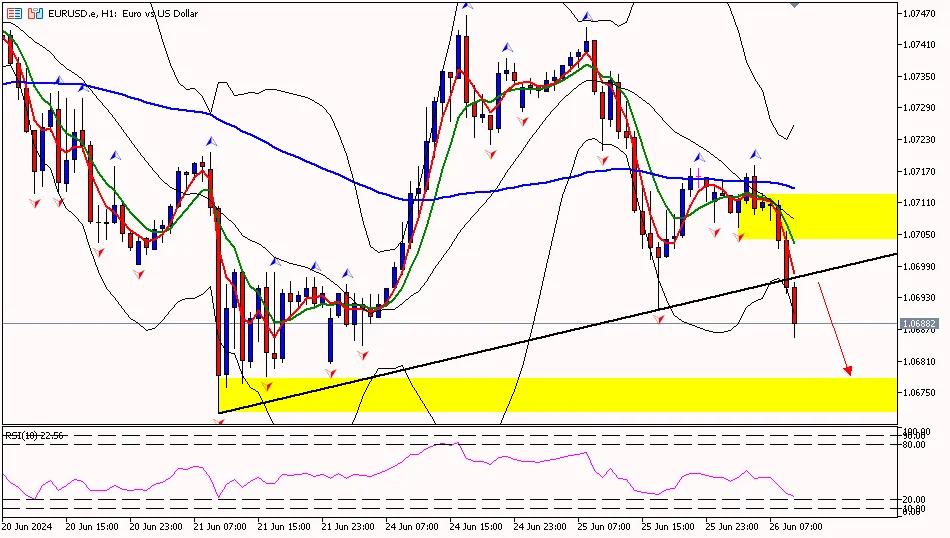
EUR/USD on the 1-hour period is below the first support area at 1.06960, attempting to move down to the second support area at 1.06670 and potentially reaching the third support at 1.06420. Meanwhile, the RSI indicator is below the pivot area, suggesting that the euro has the potential to move further down.
Suggest: Sell 1.06960 TP1 1.06670 TP2 1.06420 SL 1.07200
XAUUSD
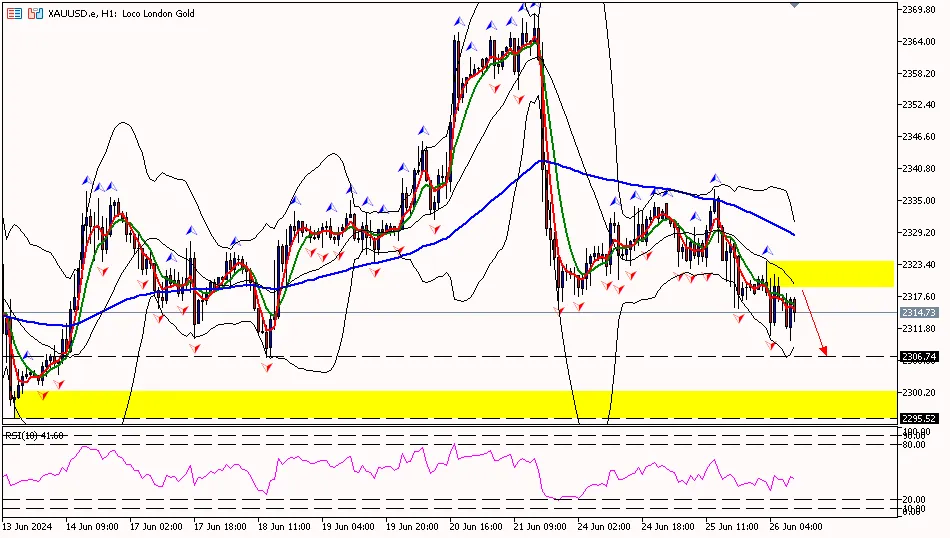
Gold prices on the 1-hour period are below the first support area at 2315.50, attempting to move down towards the second support area at 2304.70 and potentially reaching the third support area at 2293.90. Meanwhile, the RSI indicator is below the pivot area, indicating that gold prices have the potential to decline further.
Suggest: Sell 2320.00 TP1 2310.00 TP2 2300.00 SL 2325.00
CLSK (OIL)
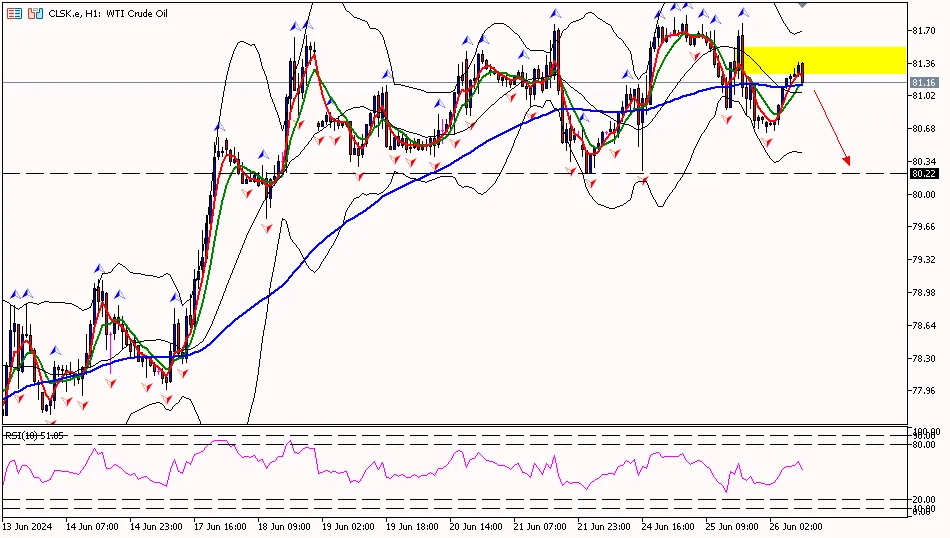
Oil prices on the 1-hour period are below the first resistance area at 81.54, with the potential to move down to the pivot area at 81.11 and further towards the first support area at 80.36. Meanwhile, the RSI indicator is at the pivot area, suggesting that oil prices have the potential to decline further.
Suggest: Sell 81.30 TP1 80.80 TP2 80.30 SL 81.80
That's the explanation of “Daily Technical Analysis: June 26, 2024 – Gold Likely to Decline Further.” Also, read our other articles, such as the explanation on how to buy cryptocurrency, only on GIC Journal. Don't forget to improve your trading skills by getting the Scalping Ebook guide. Make sure to download the GIC Mobile App on Google Play Store.
EURUSD
EUR/USD on the 1-hour period is below the first support area at 1.06960, attempting to move down to the second support area at 1.06670 and potentially reaching the third support at 1.06420. Meanwhile, the RSI indicator is below the pivot area, suggesting that the euro has the potential to move further down.
Suggest: Sell 1.06960 TP1 1.06670 TP2 1.06420 SL 1.07200
|
PREVIOUS RANGE |
||||||
|
OPEN |
HIGH |
LOW |
CLOSE |
PREV.CLOSE |
CHANGE |
%CHANGE |
|
1.07290 |
1.07443 |
1.06908 |
1.07141 |
1.07343 |
-0.00202 |
-0.19% |
|
DAILY PIVOT POINT |
||||||
|
R3 |
R2 |
R1 |
PIVOT |
S1 |
S2 |
S3 |
|
1.08030 |
1.07740 |
1.07490 |
1.07200 |
1.06960 |
1.06670 |
1.06420 |
XAUUSD
Gold prices on the 1-hour period are below the first support area at 2315.50, attempting to move down towards the second support area at 2304.70 and potentially reaching the third support area at 2293.90. Meanwhile, the RSI indicator is below the pivot area, indicating that gold prices have the potential to decline further.
Suggest: Sell 2320.00 TP1 2310.00 TP2 2300.00 SL 2325.00
|
PREVIOUS RANGE |
||||||
|
OPEN |
HIGH |
LOW |
CLOSE |
PREV.CLOSE |
CHANGE |
%CHANGE |
|
2334.57 |
2337.10 |
2315.53 |
2318.13 |
2333.07 |
-14.94 |
-0.64% |
|
DAILY PIVOT POINT |
||||||
|
R3 |
R2 |
R1 |
PIVOT |
S1 |
S2 |
S3 |
|
2358.60 |
2347.90 |
2337.10 |
2326.30 |
2315.50 |
2304.70 |
2293.90 |
CLSK (OIL)
Oil prices on the 1-hour period are below the first resistance area at 81.54, with the potential to move down to the pivot area at 81.11 and further towards the first support area at 80.36. Meanwhile, the RSI indicator is at the pivot area, suggesting that oil prices have the potential to decline further.
Suggest: Sell 81.30 TP1 80.80 TP2 80.30 SL 81.80
|
PREVIOUS RANGE |
||||||
|
OPEN |
HIGH |
LOW |
CLOSE |
PREV.CLOSE |
CHANGE |
%CHANGE |
|
81.70 |
81.86 |
80.68 |
80.78 |
81.65 |
-0.87 |
-1.07% |
|
DAILY PIVOT POINT |
||||||
|
R3 |
R2 |
R1 |
PIVOT |
S1 |
S2 |
S3 |
|
82.72 |
82.29 |
81.54 |
81.11 |
80.36 |
79.93 |
|
That's the explanation of “Daily Technical Analysis: June 26, 2024 – Gold Likely to Decline Further.” Also, read our other articles, such as the explanation on how to buy cryptocurrency, only on GIC Journal. Don't forget to improve your trading skills by getting the Scalping Ebook guide. Make sure to download the GIC Mobile App on Google Play Store.


