 Last:
Last: 
Here is the daily technical analysis for July 9, 2024. The data and analysis in this bulletin can be widely used for your trading. However, it should be noted that GICTrade and the data provider are not responsible for the results of your trading.
We will now provide the forecasted price movements in Forex and Commodities, along with calculations of Pivot points, Resistance, and Support levels.
USDJPY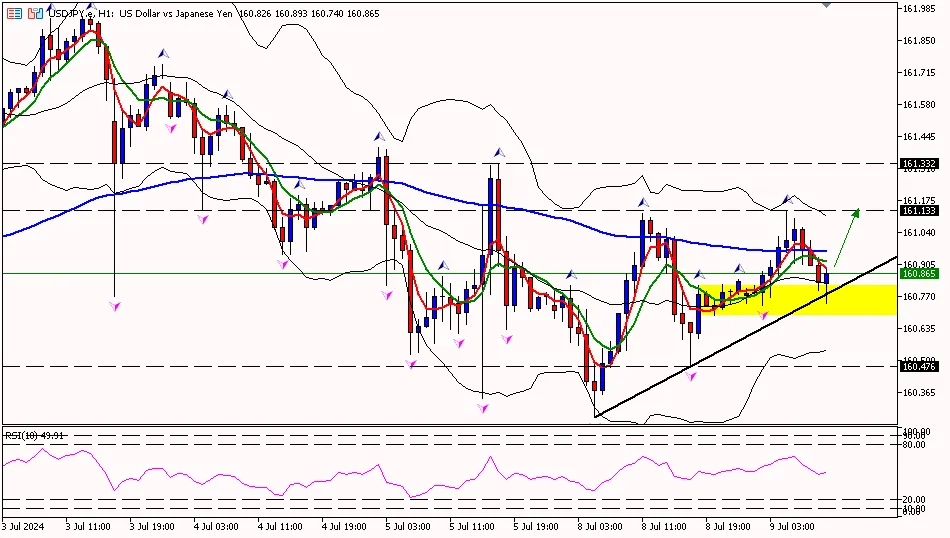
USD/JPY on the 1-hour period is above the pivot area at 160.740, attempting to move up towards the first resistance area at 161.220 and further to the second resistance area at 161.600. Meanwhile, the RSI indicator is at the pivot area, indicating that the yen has the potential to move up further.
Suggest: Buy 160.800 TP1 161.000 TP2 161.250 SL 160.600
|
PREVIOUS RANGE |
||||||
|
OPEN |
HIGH |
LOW |
CLOSE |
PREV.CLOSE |
CHANGE |
%CHANGE |
|
160.734 |
161.119 |
160.261 |
160.834 |
160.779 |
0.055 |
0.03% |
|
DAILY PIVOT POINT |
||||||
|
R3 |
R2 |
R1 |
PIVOT |
S1 |
S2 |
S3 |
|
162.080 |
161.600 |
161.220 |
160.740 |
160.360 |
159.880 |
159.500 |
XAUUSD
Gold prices on the 1-hour period are below the pivot area at 2371.90, attempting to move down towards the first support area at 2352.70 and further to the second support area at 2331.90. Meanwhile, the RSI indicator is below the pivot area, indicating that gold prices have the potential to move down further.
Suggest: Sell 2365.00 TP1 2360.00 TP2 2350.00 SL 2370.00
|
PREVIOUS RANGE |
||||||
|
OPEN |
HIGH |
LOW |
CLOSE |
PREV.CLOSE |
CHANGE |
%CHANGE |
|
2387.13 |
2391.09 |
2351.04 |
2358.28 |
2388.91 |
-30.63 |
-1.28% |
|
DAILY PIVOT POINT |
||||||
|
R3 |
R2 |
R1 |
PIVOT |
S1 |
S2 |
S3 |
|
2432.80 |
2412.00 |
2392.80 |
2371.90 |
2352.70 |
2331.90 |
2312.70 |
CLSK (OIL)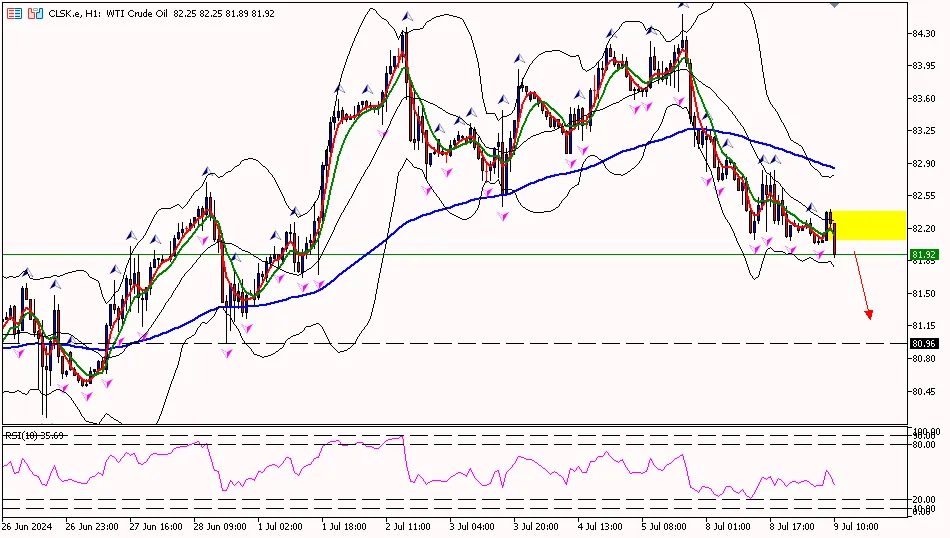
Oil prices on the 1-hour period are below the pivot area at 82.54, with the potential to move down to the first support area at 81.78 and further to the second support area at 81.31. Meanwhile, the RSI indicator is below the pivot area, indicating that oil prices may continue to move down further.
Suggest: Sell 82.20 TP1 81.70 TP2 81.20 SL 82.70
|
PREVIOUS RANGE |
||||||
|
OPEN |
HIGH |
LOW |
CLOSE |
PREV.CLOSE |
CHANGE |
%CHANGE |
|
83.16 |
83.30 |
82.07 |
82.25 |
83.24 |
-0.99 |
-1.19% |
|
DAILY PIVOT POINT |
||||||
|
R3 |
R2 |
R1 |
PIVOT |
S1 |
S2 |
S3 |
|
84.24 |
83.77 |
83.01 |
82.54 |
81.78 |
81.31 |
80.55 |


