 Last:
Last: 
The following is the daily technical analysis for July 8, 2024. The data and analysis presented in this bulletin can be used broadly for your trading. However, it is important to note that GICTrade and the data providers are not responsible for your trading results.
We will now provide forecasts for price movements in Forex and Commodities, along with calculations of Pivot Points, Resistance, and Support levels.
GBPUSD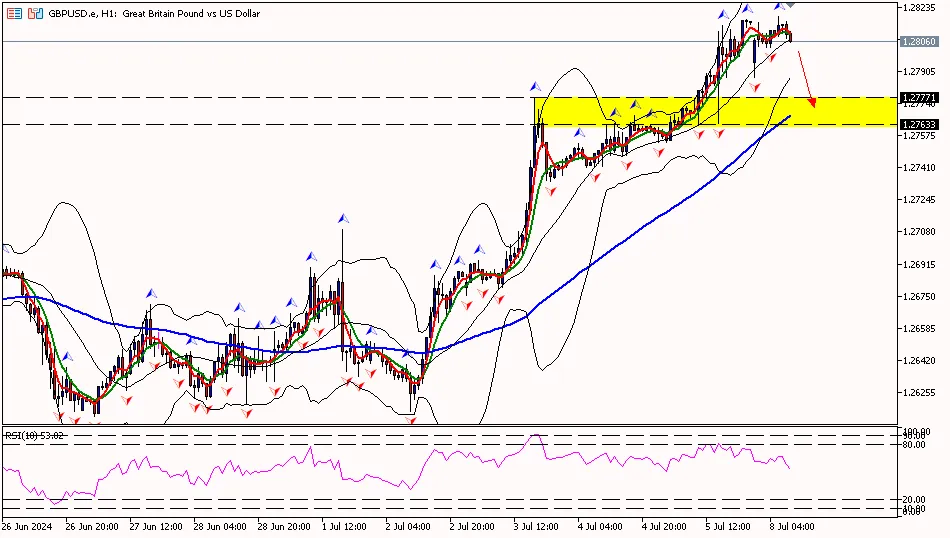
GBP/USD on the 1-hour period is below the first resistance area at 1.28180, attempting to move down to the pivot area at 1.27860 and further towards the first support area at 1.27550. Meanwhile, the RSI indicator is in the pivot area, suggesting that the pound sterling has the potential to move down further.
Suggest: Sell 1.28150 TP1 1.27900 TP2 1.27600 SL 1.27350
|
PREVIOUS RANGE |
||||||
|
OPEN |
HIGH |
LOW |
CLOSE |
PREV.CLOSE |
CHANGE |
%CHANGE |
|
1.27584 |
1.28172 |
1.27538 |
1.28158 |
1.27584 |
0.00574 |
0.45% |
|
DAILY PIVOT POINT |
||||||
|
R3 |
R2 |
R1 |
PIVOT |
S1 |
S2 |
S3 |
|
1.28820 |
1.28490 |
1.28180 |
1.27860 |
1.27550 |
1.27230 |
1.26910 |
XAUUSD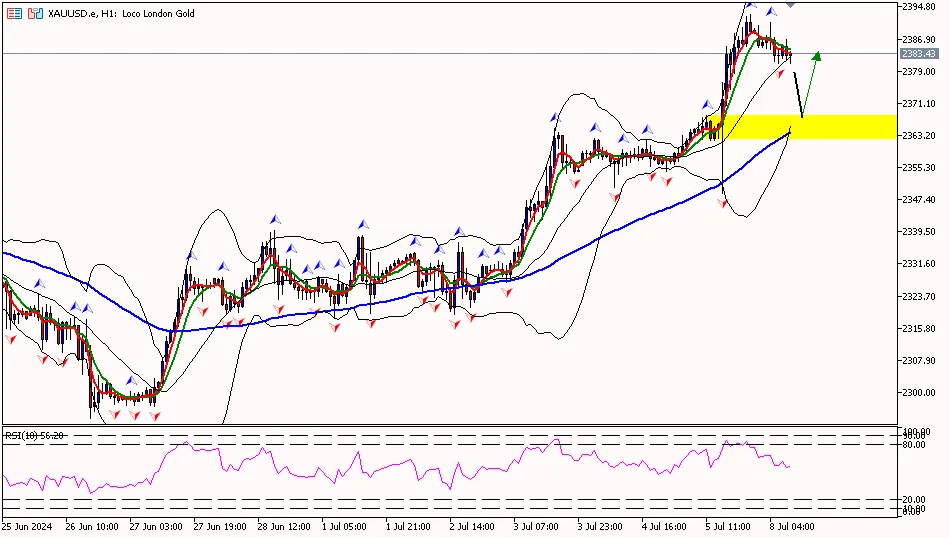
The price of gold on the 1-hour timeframe is below the first resistance area at 2395.10, attempting to move down toward the pivot area at 2372.00 and then towards the first support area at 2351.10. Meanwhile, the RSI indicator is at the pivot area, suggesting that the price of gold has the potential to move down further.
Suggest: Sell 2395.00 TP1 2385.00 TP2 2375.00 SL 2400.00
|
PREVIOUS RANGE |
||||||
|
OPEN |
HIGH |
LOW |
CLOSE |
PREV.CLOSE |
CHANGE |
%CHANGE |
|
2357.18 |
2392.93 |
2348.95 |
2388.91 |
2356.92 |
31.99 |
1.36% |
|
DAILY PIVOT POINT |
||||||
|
R3 |
R2 |
R1 |
PIVOT |
S1 |
S2 |
S3 |
|
2439.00 |
2416.00 |
2395.10 |
2372.00 |
2351.10 |
2328.00 |
2307.10 |
CLSK (OIL)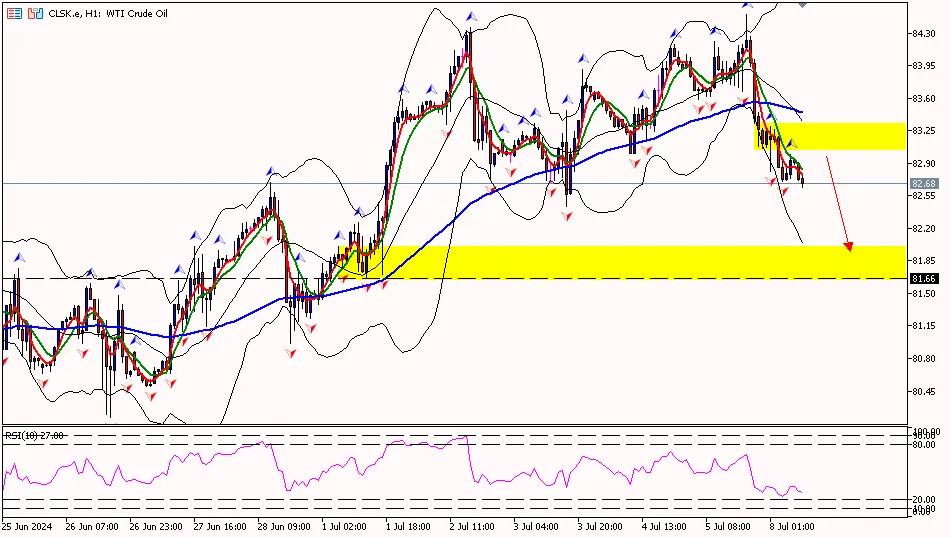
The price of oil on the 1-hour timeframe is below the first support area at 82.70, with the potential to move down to the second support area at 82.16 and then toward the third support area at 81.26. Meanwhile, the RSI indicator is below the pivot area, suggesting that the price of oil has the potential to move down further.
Suggest: Sell 82.80 TP1 82.30 TP2 81.80 SL 83.30
|
PREVIOUS RANGE |
||||||
|
OPEN |
HIGH |
LOW |
CLOSE |
PREV.CLOSE |
CHANGE |
%CHANGE |
|
84.04 |
84.50 |
83.06 |
83.24 |
84.05 |
-0.81 |
-0.96% |
|
DAILY PIVOT POINT |
||||||
|
R3 |
R2 |
R1 |
PIVOT |
S1 |
S2 |
S3 |
|
85.58 |
85.04 |
84.14 |
83.60 |
82.70 |
82.16 |
81.26 |
Well, that’s the explanation about "Daily Technical Analysis: July 8, 2024 – US Dollar Plummets." Also, read our other articles, such as the explanation on how to buy cryptocurrency, only at Jurnal GIC. Don’t forget to hone your trading skills by getting the Ebook Scalping guidebook. Make sure to download the GIC Mobile App on the Google Play Store.


