 Last:
Last: 
Here is the daily technical analysis for July 30, 2024. The data and analysis in this bulletin can be widely applied to your trading. However, it should be noted that GICTrade and the data providers are not responsible for the results of your trading.
Below, we will provide a forecast of price movements in Forex and Commodities, along with calculations for Pivot Point levels, Resistance, and Support.
GBPUSD
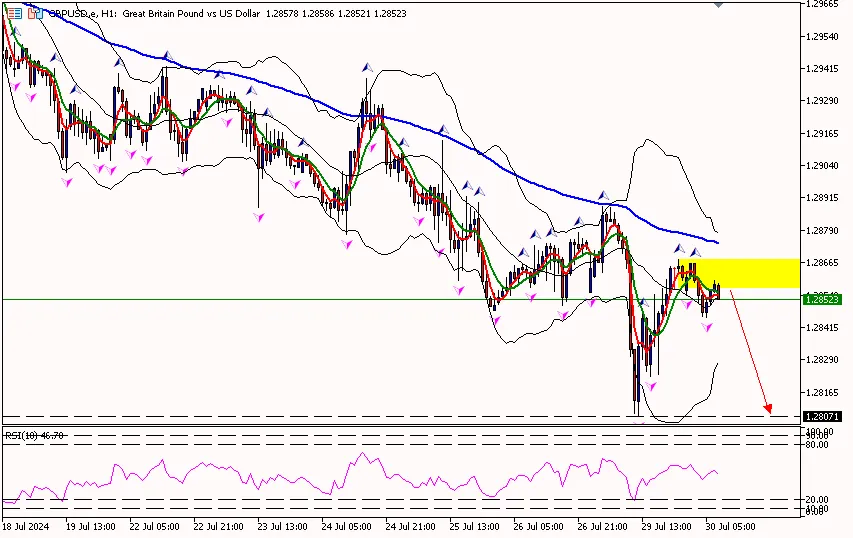
GBP/USD on the 1-hour period is in the pivot area at 1.28530, attempting to move down towards the first support area at 1.28180, and potentially reaching the second support area at 1.27720. Meanwhile, the RSI indicator is below the pivot area, indicating that the pound may have further potential to decline.
Suggest: Sell 1.28600 TP1 1.28350 TP2 1.28100 SL 1.28850
GBPUSD
GBP/USD on the 1-hour period is in the pivot area at 1.28530, attempting to move down towards the first support area at 1.28180, and potentially reaching the second support area at 1.27720. Meanwhile, the RSI indicator is below the pivot area, indicating that the pound may have further potential to decline.
Suggest: Sell 1.28600 TP1 1.28350 TP2 1.28100 SL 1.28850
|
PREVIOUS RANGE |
||||||
|
OPEN |
HIGH |
LOW |
CLOSE |
PREV.CLOSE |
CHANGE |
%CHANGE |
|
1.28550 |
1.28883 |
1.28070 |
1.28609 |
1.28743 |
-0.00134 |
-0.10% |
|
DAILY PIVOT POINT |
||||||
|
R3 |
R2 |
R1 |
PIVOT |
S1 |
S2 |
S3 |
|
1.29800 |
1.29340 |
1.28990 |
1.28530 |
1.28180 |
1.27720 |
1.27360 |
XAUUSD
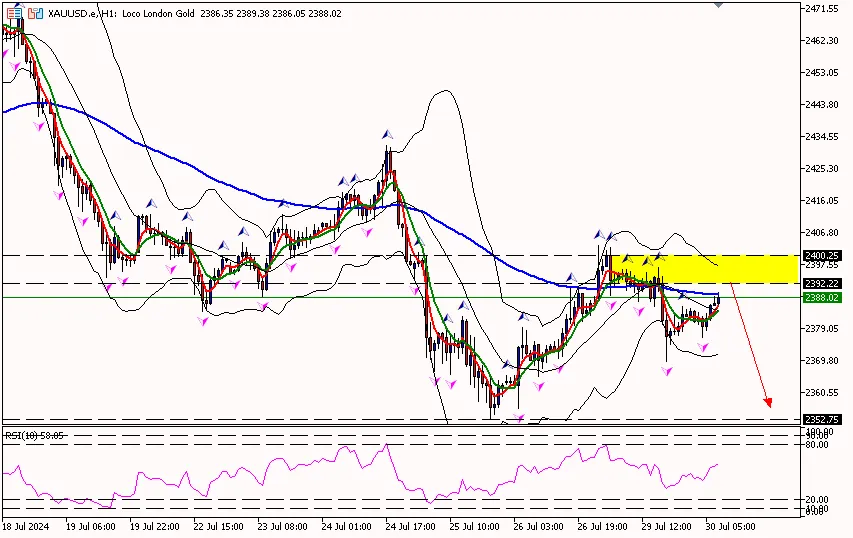
Gold prices on the 1-hour period are above the pivot area at 2385.80, attempting to move up towards the first resistance area at 2402.00, and potentially reaching the second resistance area at 2419.30. Meanwhile, the RSI indicator is above the pivot area, suggesting that gold prices have the potential to rise further before correcting after hitting the RSI overbought level.
Suggest: Sell 2395.00 TP1 2385.00 TP2 2375.00 SL 2405.00
|
PREVIOUS RANGE |
||||||
|
OPEN |
HIGH |
LOW |
CLOSE |
PREV.CLOSE |
CHANGE |
%CHANGE |
|
2387.97 |
2403.13 |
2369.65 |
2382.54 |
2386.44 |
-3.90 |
-0.16% |
|
DAILY PIVOT POINT |
||||||
|
R3 |
R2 |
R1 |
PIVOT |
S1 |
S2 |
S3 |
|
2435.40 |
2419.30 |
2402.00 |
2385.80 |
2368.50 |
2352.30 |
2335.00 |
CLSK (OIL)
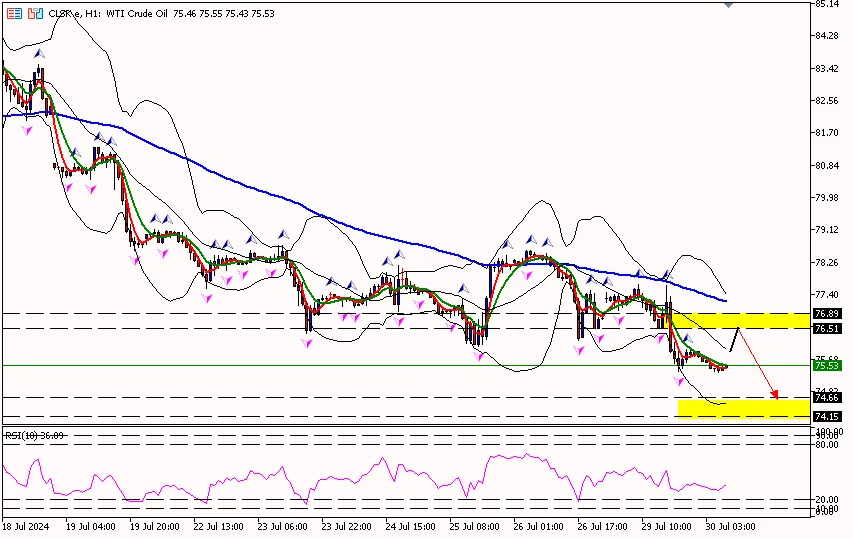
Oil prices on the 1-hour period are below the pivot area at 76.30, with the potential to move down to the first support area at 74.94 and possibly reaching the second support area at 73.99. Meanwhile, the RSI indicator is below the pivot area, indicating that oil prices may have further potential to decline.
Suggest: Sell 76.30 TP1 75.80 TP2 75.30 SL 76.80
|
PREVIOUS RANGE |
||||||
|
OPEN |
HIGH |
LOW |
CLOSE |
PREV.CLOSE |
CHANGE |
%CHANGE |
|
77.30 |
77.66 |
75.35 |
75.88 |
76.77 |
-0.89 |
-1.16% |
|
DAILY PIVOT POINT |
||||||
|
R3 |
R2 |
R1 |
PIVOT |
S1 |
S2 |
S3 |
|
79.56 |
78.61 |
77.25 |
76.30 |
74.94 |
73.99 |
72.63 |
That was the explanation of the "Daily Technical Analysis: July 30, 2024 – US Dollar Remains Stable." Be sure to read our other articles, such as the explanation of how to buy cryptocurrency, only on the GIC Journal. Don't forget to sharpen your trading skills by getting the Scalping Ebook guidebook. Make sure to download the GIC Mobile App on Google Play Store.


