 Last:
Last: 
Here is the daily technical analysis for July 29, 2024. The data and analysis contained in this bulletin can be broadly applied to your trading. However, it is important to note that GICTrade and the data providers are not responsible for the results of your trading.
Below, we will provide a forecast of price movements in Forex and Commodities, along with calculations for Pivot Point levels, Resistance, and Support.
USDJPY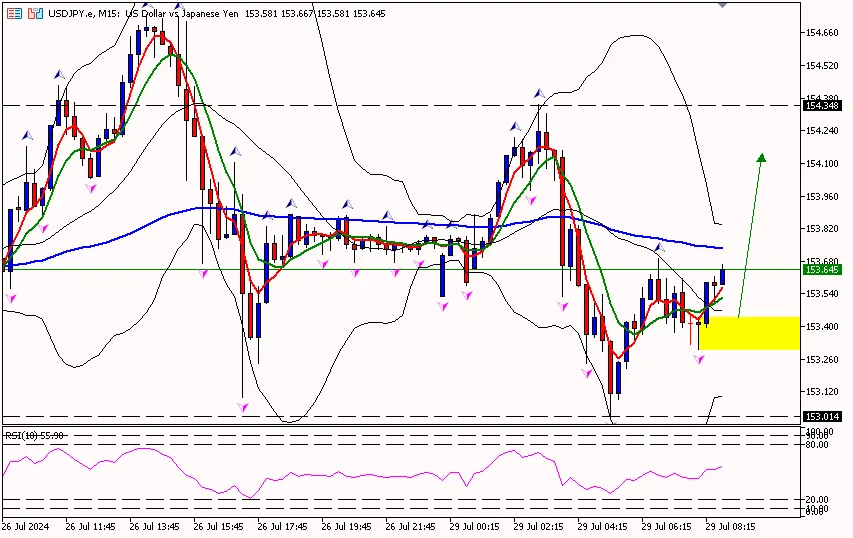
USD/JPY on the 15-minute period is above the first support area at 153.000, attempting to move up towards the pivot area at 153.870, and potentially reaching the first resistance area at 154.650. Meanwhile, the RSI indicator is above the pivot area, suggesting that the yen may have further potential to rise.
Suggest: Buy 153.400 TP1 153.700 TP2 154.000 SL 153.100
|
PREVIOUS RANGE |
||||||
|
OPEN |
HIGH |
LOW |
CLOSE |
PREV.CLOSE |
CHANGE |
%CHANGE |
|
153.871 |
154.737 |
153.094 |
153.762 |
153.939 |
-0.177 |
-0.11% |
|
DAILY PIVOT POINT |
||||||
|
R3 |
R2 |
R1 |
PIVOT |
S1 |
S2 |
S3 |
|
156.290 |
155.510 |
154.650 |
153.870 |
153.000 |
152.230 |
151.360 |
XAUUSD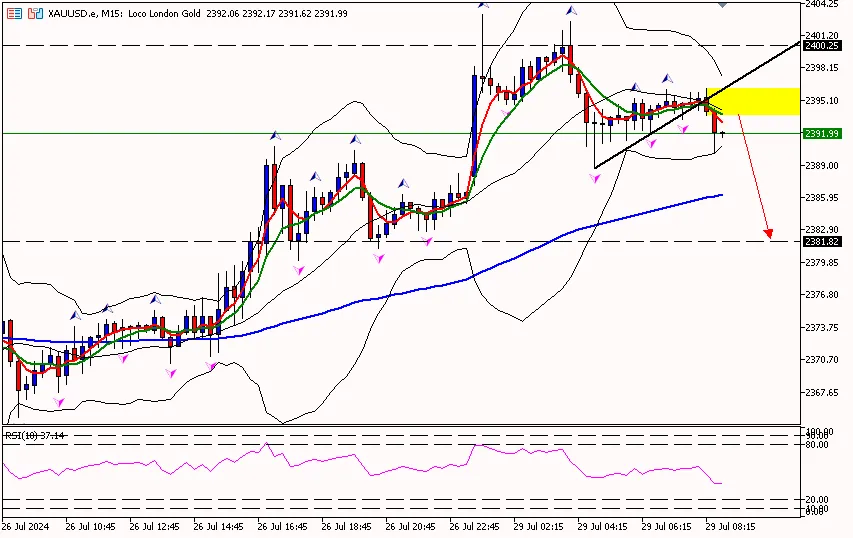
Gold prices on the 15-minute period are below the first resistance area at 2392.60, attempting to move down towards the pivot area at 2374.20, and potentially reaching the first support area at 2357.60. Meanwhile, the RSI indicator is below the pivot area, indicating that gold prices may have further potential to decline.
Suggest: Sell 2395.00 TP1 2390.00 TP2 2380.00 SL 2400.00
|
PREVIOUS RANGE |
||||||
|
OPEN |
HIGH |
LOW |
CLOSE |
PREV.CLOSE |
CHANGE |
%CHANGE |
|
2363.72 |
2390.78 |
2355.82 |
2386.44 |
2361.72 |
24.72 |
1.05% |
|
DAILY PIVOT POINT |
||||||
|
R3 |
R2 |
R1 |
PIVOT |
S1 |
S2 |
S3 |
|
2427.50 |
2409.20 |
2392.60 |
2374.20 |
2357.60 |
2339.20 |
2322.70 |
CLSK (OIL)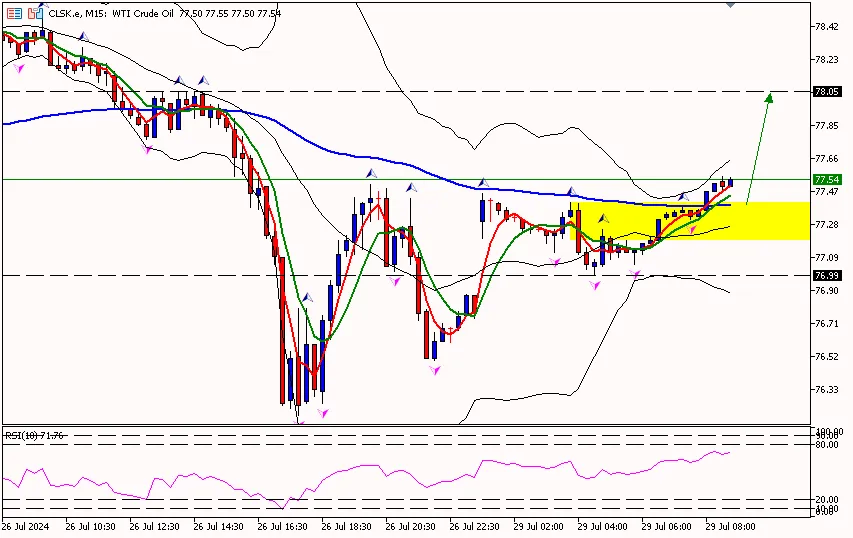
Oil prices on the 15-minute period are above the pivot area at 77.17, with the potential to move up to the first resistance area at 78.16 and possibly reaching the second resistance area at 79.56. Meanwhile, the RSI indicator is above the pivot area, suggesting that oil prices may have further potential to rise.
Suggest: Buy 77.40 TP1 77.80 TP2 78.20 SL 77.00
|
PREVIOUS RANGE |
||||||
|
OPEN |
HIGH |
LOW |
CLOSE |
PREV.CLOSE |
CHANGE |
%CHANGE |
|
78.31 |
78.57 |
76.18 |
76.77 |
78.15 |
-1.38 |
-1.77% |
|
DAILY PIVOT POINT |
||||||
|
R3 |
R2 |
R1 |
PIVOT |
S1 |
S2 |
S3 |
|
80.55 |
79.56 |
78.16 |
77.17 |
75.77 |
74.78 |
73.38 |
That was the explanation of the "Daily Technical Analysis: July 29, 2024 – Weak Inflation, US Dollar Declines." Be sure to read our other articles, such as the guide on how to buy cryptocurrency, only on the GIC Journal. Don’t forget to sharpen your trading skills by getting the Scalping Ebook guide. Make sure to download the GIC Mobile App from the Google Play Store.


