 Last:
Last: 
Here is the daily technical analysis for July 10, 2024. The data and analysis in this bulletin can be widely used for your trading. However, it should be noted that GICTrade and the data provider are not responsible for the results of your trading.
We will now provide the forecasted price movements in Forex and Commodities, along with calculations of Pivot points, Resistance, and Support levels.
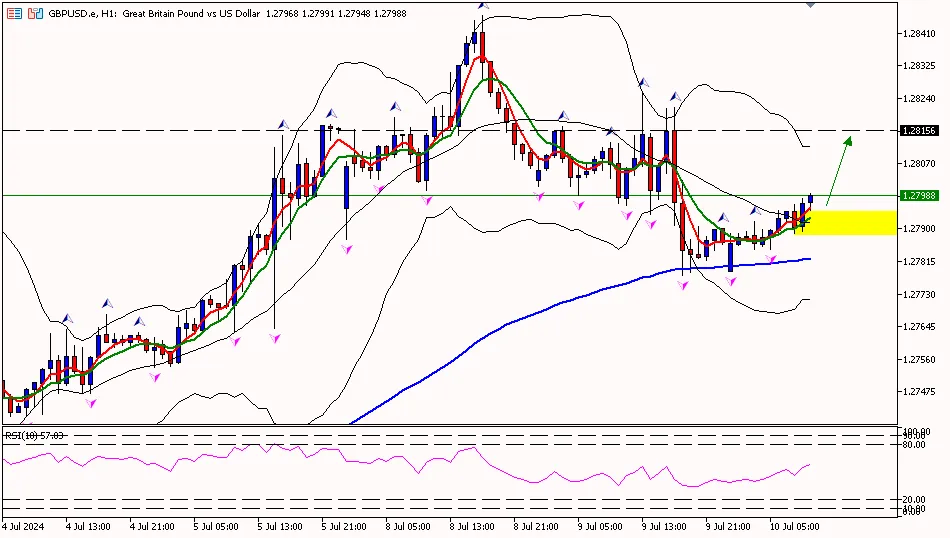
GBPUSD
GBP/USD on the 1-hour period is above the pivot area at 1.27980, attempting to move up to the first resistance area at 1.28180 and further to the second resistance area at 1.28450. Meanwhile, the RSI indicator is above the pivot area, indicating that the pound sterling has the potential to move up further.
Suggest: Buy 1.27950 TP1 1.28180 TP2 1.28450 SL 1.27710
|
PREVIOUS RANGE |
||||||
|
OPEN |
HIGH |
LOW |
CLOSE |
PREV.CLOSE |
CHANGE |
%CHANGE |
|
1.28026 |
1.28252 |
1.27779 |
1.27864 |
1.28065 |
-0.00201 |
-0.16% |
|
DAILY PIVOT POINT |
||||||
|
R3 |
R2 |
R1 |
PIVOT |
S1 |
S2 |
S3 |
|
1.28650 |
1.28450 |
1.28180 |
1.27980 |
1.27710 |
1.27510 |
1.27240 |
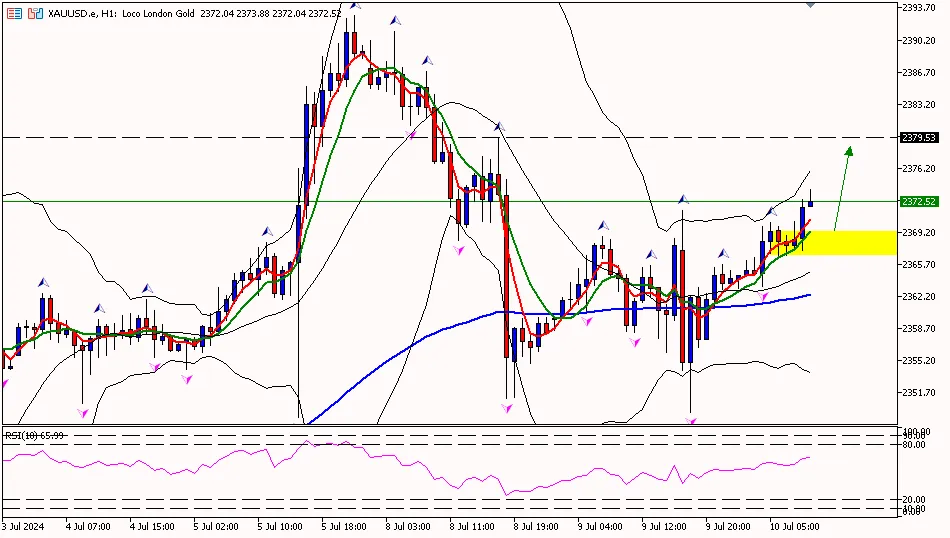
XAUUSD
Gold prices on the 1-hour period are above the pivot area at 2361.20, attempting to move up towards the first resistance area at 2372.90 and further to the second resistance area at 2383.30. Meanwhile, the RSI indicator is above the pivot area, indicating that gold prices have the potential to move up further.
Suggest: Buy 2367.50 TP1 2372.50 TP2 2382.50 SL 2362.50
|
PREVIOUS RANGE |
||||||
|
OPEN |
HIGH |
LOW |
CLOSE |
PREV.CLOSE |
CHANGE |
%CHANGE |
|
2359.70 |
2371.53 |
2349.46 |
2364.16 |
2358.28 |
5.88 |
0.25% |
|
DAILY PIVOT POINT |
||||||
|
R3 |
R2 |
R1 |
PIVOT |
S1 |
S2 |
S3 |
|
2395.00 |
2383.30 |
2372.90 |
2361.20 |
2350.90 |
2339.10 |
2328.80 |
CLSK (OIL)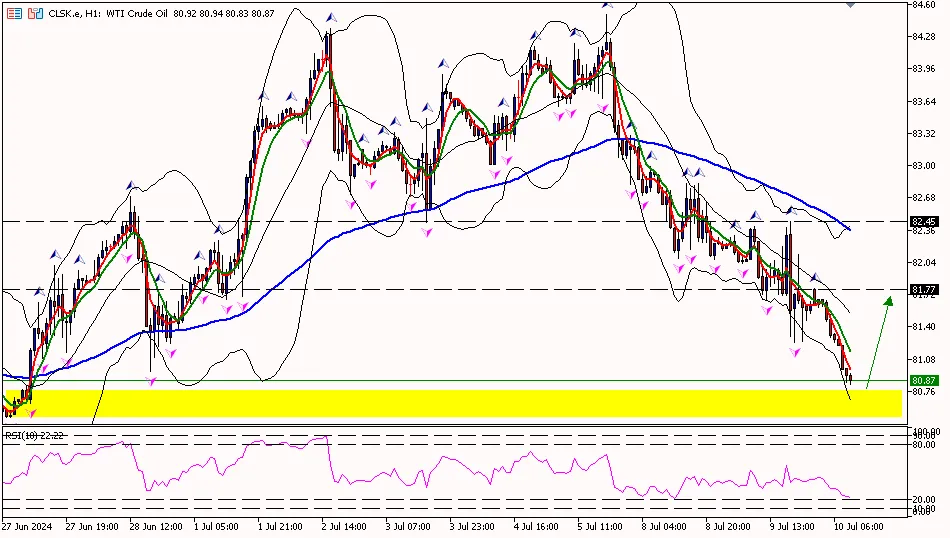
Oil prices on the 1-hour period are below the first support area at 81.09, with the potential to move down to the second support area at 80.56 and further to the third support area at 79.88. Meanwhile, the RSI indicator is below the pivot area or in the oversold zone, indicating that oil prices have the potential to rebound.
Suggest: Buy 80.70 TP1 81.20 TP2 81.70 SL 80.20
|
PREVIOUS RANGE |
||||||
|
OPEN |
HIGH |
LOW |
CLOSE |
PREV.CLOSE |
CHANGE |
%CHANGE |
|
82.21 |
82.45 |
81.24 |
81.62 |
82.25 |
-0.63 |
-0.77% |
|
DAILY PIVOT POINT |
||||||
|
R3 |
R2 |
R1 |
PIVOT |
S1 |
S2 |
S3 |
|
83.51 |
82.98 |
82.30 |
81.77 |
81.09 |
80.56 |
79.88 |
Well, that concludes the explanation of "Daily Technical Analysis: July 10, 2024 – US Dollar Has Correction Potential." Also, check out our other articles, such as the guide on how to buy cryptocurrency, only at Jurnal GIC. Don’t forget to sharpen your trading skills by getting the Ebook Scalping guide. Make sure to download the GIC Mobile Apps from the Google Play Store.


