 Last:
Last: 
The following is a daily technical analysis, January 13, 2023. The data and analysis contained in this newsletter can be used on a wide scale for your trading. However, it is important to note that GICTrade and its data providers are not responsible for your trading results.
So, it's your own responsibility. Before knowing today's technical analysis, immediately register yourself to take part in the GIC Gebyar Prize and get the main prize, namely Mobile Mitshubshi Expander or Vacation Package to Labuan Bajo for 4 days and 3 nights.
In the following, we will inform you about the forecast of price movements in Forex and Commodities which is equipped with the calculation of Pivot points, Resistance and Support levels.
EURUSD
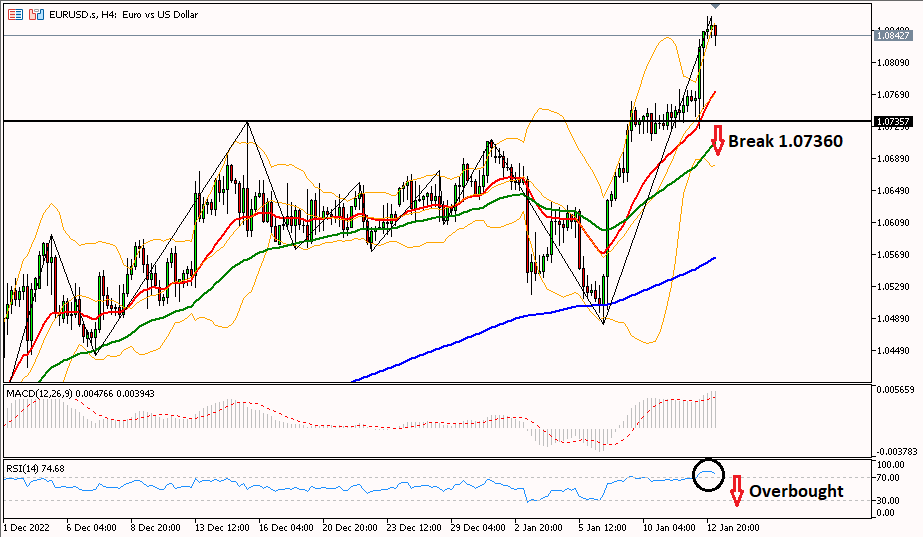
EUR/USD is still in an uptrend, needing a break of resistance (R1) 1.08740 to continue bullish to the 1.09400 area. However, referring to the RSI indicator in the 4-hour period which is already in the overbought area, the euro has the opportunity to correct after breaking through the 1.07360 area towards the support target (S2) at 1.06600.
|
PREVIOUS RANGE |
||||||
|
OPEN |
HIGH |
LOW |
CLOSE |
PREV.CLOSE |
CHANGE |
%CHANGE |
|
1.07554 |
1.08662 |
1.07263 |
1.08501 |
1.07554 |
0.00947 |
0.88% |
|
DAILY PIVOT POINT |
||||||
|
R3 |
R2 |
R1 |
PIVOT |
S1 |
S2 |
S3 |
|
1.10140 |
1.09400 |
1.08740 |
1.08000 |
1.07340 |
1.06600 |
1.05940 |
GBPUSD
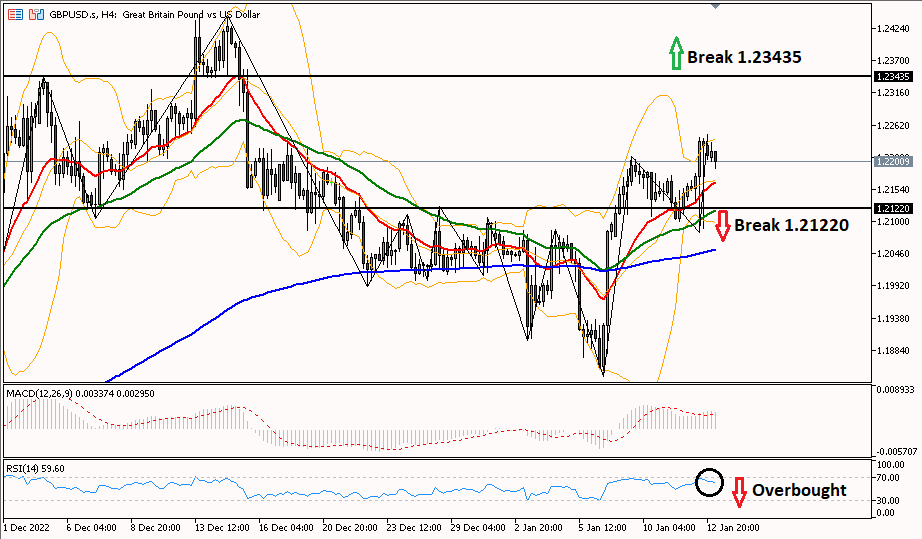
The daily technical analysis for the GBP/USD pair has a chance to correct with the 4-hour RSI which is already in the overbought area. It is necessary to break 1.21220 towards the support (S1) at 1.20960 first to change the bias to bearish. However, the rise will continue if it is able to pass through the 1.23435 area to resistance (R3) at 1.24240.
|
PREVIOUS RANGE |
||||||
|
OPEN |
HIGH |
LOW |
CLOSE |
PREV.CLOSE |
CHANGE |
%CHANGE |
|
1.21424 |
1.22460 |
1.20822 |
1.22116 |
1.21467 |
0.00649 |
0.54% |
|
DAILY PIVOT POINT |
||||||
|
R3 |
R2 |
R1 |
PIVOT |
S1 |
S2 |
S3 |
|
1.24240 |
1.23350 |
1.22600 |
1.21710 |
1.20960 |
1.20070 |
1.19320 |
AUDUSD
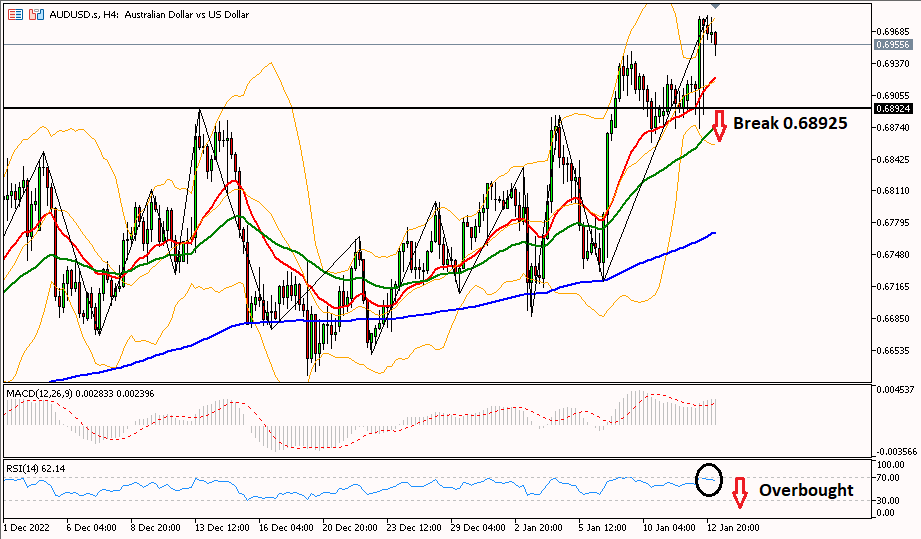
AUD/USD on the 4-hour period tends to consolidate or move down, with the RSI in the overbought area confirming the decline. It needs to break the 0.68925 area to change the bias to bearish with the next support target (S2) at 0.68190. However, the bulls will be strong once the aussie is able to break through the resistance area (R1) at 0.69900 to R2 at 0.70430.
|
PREVIOUS RANGE |
||||||
|
OPEN |
HIGH |
LOW |
CLOSE |
PREV.CLOSE |
CHANGE |
%CHANGE |
|
0.68998 |
0.69839 |
0.68722 |
0.69662 |
0.69049 |
0.00613 |
0.88% |
|
DAILY PIVOT POINT |
||||||
|
R3 |
R2 |
R1 |
PIVOT |
S1 |
S2 |
S3 |
|
0.71020 |
0.70430 |
0.69900 |
0.69310 |
0.68780 |
0.68190 |
0.67660 |
USDCHF
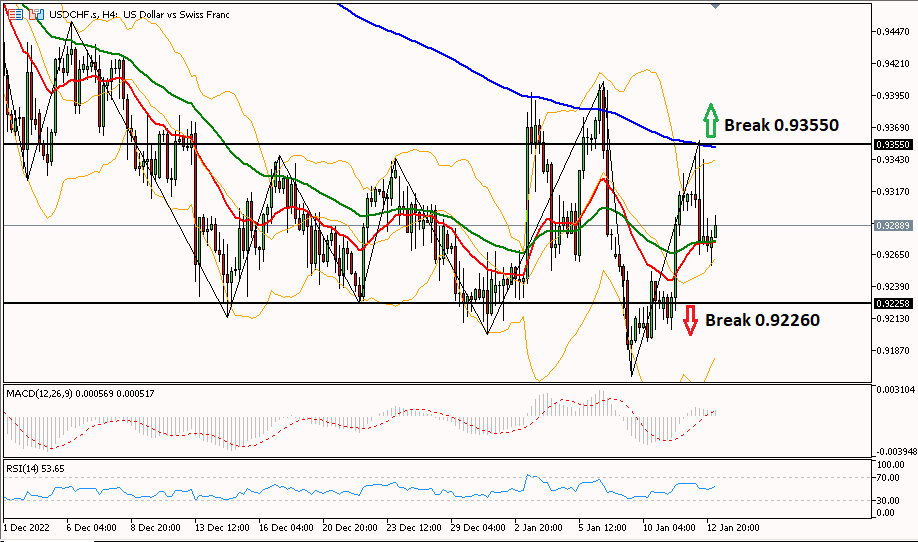
Daily technical analysis for the USD/CHF pair is trying to move upwards towards the 70 RSI area in the 4-hour period. If it crosses 0.93550 then the bullish bias will continue until the resistance (R2) at 0.93940. Meanwhile, to continue the downtrend, the franc crossed the 0.92260 area towards the next support (S3) at 0.91510.
|
PREVIOUS RANGE |
||||||
|
OPEN |
HIGH |
LOW |
CLOSE |
PREV.CLOSE |
CHANGE |
%CHANGE |
|
0.93086 |
0.93583 |
0.92654 |
0.92727 |
0.93122 |
-0.00395 |
-0.43% |
|
DAILY PIVOT POINT |
||||||
|
R3 |
R2 |
R1 |
PIVOT |
S1 |
S2 |
S3 |
|
0.94300 |
0.93940 |
0.93370 |
0.93010 |
0.92440 |
0.92080 |
0.91510 |
USDJPY
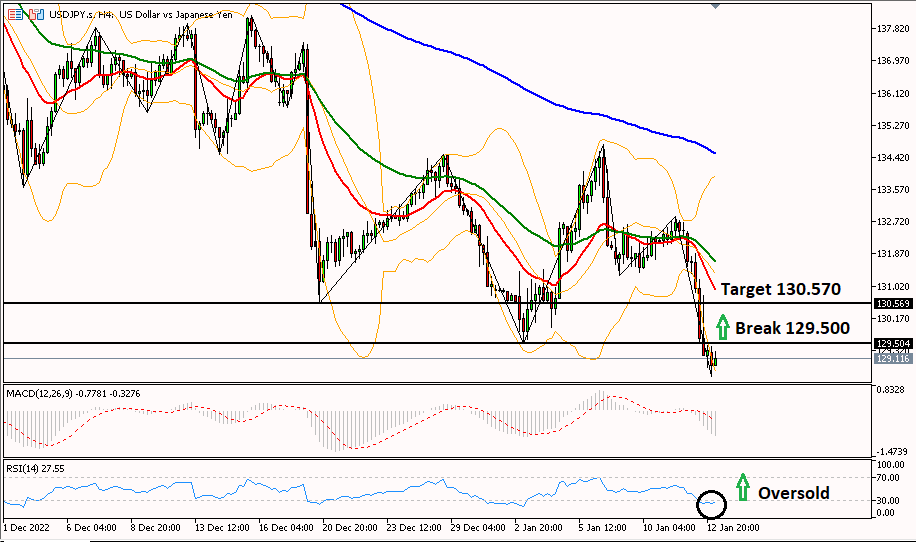
USD/JPY has the potential to rebound after the RSI shows oversold. It needs to break the 129,500 area to change the bias to bullish with the nearest target at 130,570. Meanwhile, to continue the decline, the yen needs to pass through the 129,060 support area again to the next support (S2) at 127,160.
|
PREVIOUS RANGE |
||||||
|
OPEN |
HIGH |
LOW |
CLOSE |
PREV.CLOSE |
CHANGE |
%CHANGE |
|
132.422 |
132.465 |
128.860 |
129.311 |
132.482 |
-3.171 |
-2.39% |
|
DAILY PIVOT POINT |
||||||
|
R3 |
R2 |
R1 |
PIVOT |
S1 |
S2 |
S3 |
|
136.260 |
134.370 |
132.660 |
130.760 |
129.060 |
127.160 |
125.450 |
XUL (LOCO LONDON GOLD)
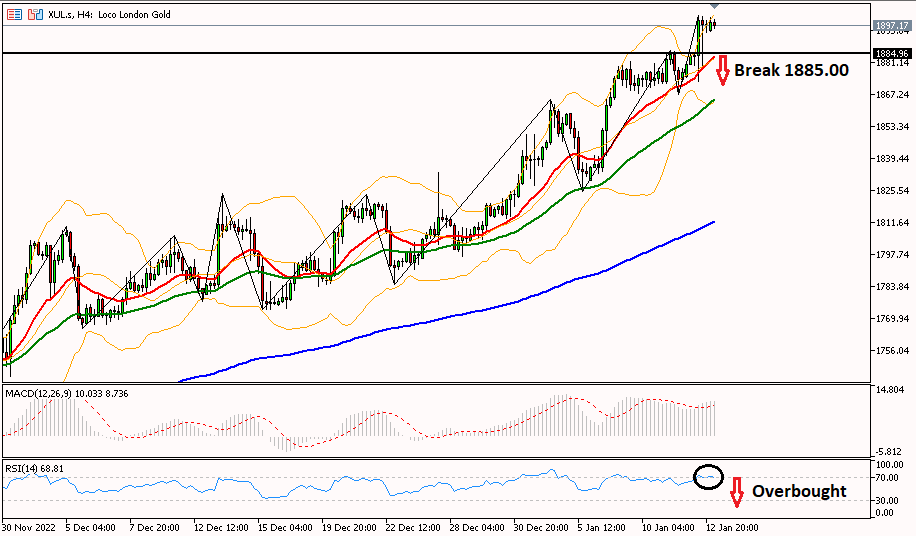
Daily technical analysis for gold prices has the potential to be corrected, which is indicated by the RSI which is already in the overbought area. It is necessary to break the 1885.00 area first to change the bias to bearish until the next support (S2) 1871.90. However, to continue the bullish trend, gold needs to pass through the area of 1915.30 to the resistance (R3) at 1929.10.
|
PREVIOUS RANGE |
||||||
|
OPEN |
HIGH |
LOW |
CLOSE |
PREV.CLOSE |
CHANGE |
%CHANGE |
|
1874.96 |
1901.46 |
1872.86 |
1897.63 |
1876.66 |
20.97 |
1.12% |
|
DAILY PIVOT POINT |
||||||
|
R3 |
R2 |
R1 |
PIVOT |
S1 |
S2 |
S3 |
|
1929.10 |
1915.30 |
1900.50 |
1886.70 |
1871.90 |
1858.10 |
1843.30 |
CLSK (OIL)
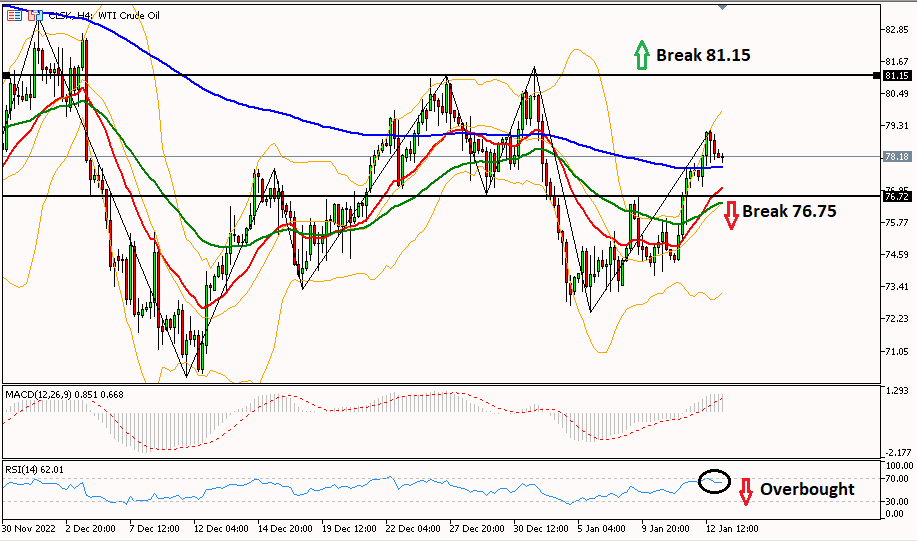
Oil prices have the potential to fall, if they are able to break through the 76.75 area towards the next support (Q2) at 75.17. The decline in oil prices was supported by the 4-hour RSI which was in the overbought area. However, for further gains it is necessary to confirm the 79.27 (R1) area towards the next resistance (R2) at 80.23 to R3 at 81.32.
|
PREVIOUS RANGE |
||||||
|
OPEN |
HIGH |
LOW |
CLOSE |
PREV.CLOSE |
CHANGE |
%CHANGE |
|
77.68 |
79.14 |
77.09 |
78.30 |
77.63 |
0.67 |
0.86% |
|
DAILY PIVOT POINT |
||||||
|
R3 |
R2 |
R1 |
PIVOT |
S1 |
S2 |
S3 |
|
81.32 |
80.23 |
79.27 |
78.18 |
77.22 |
76.13 |
75.17 |
So, that's the explanation of "Technical Daily Analysis: January 13, 2023 – US Inflation Down, Greenback Down". Also read our other articles, such as an explanation of how to buy cryptocurrencies, only in the GIC Journal. Don't forget to practice your trading skills by getting the Scalping Ebook and following Live Trading on NFP Live Trading. Make sure, download GIC Mobile Apps on the Google Play Store.


