 Last:
Last: 
Below is the daily technical analysis for August 2, 2024. The data and analysis in this bulletin can be widely used for your trading. However, it is important to note that GICTrade and the data providers are not responsible for your trading results.
We will now provide information on the forecast for price movements in Forex and Commodities, complete with calculations for Pivot points, Resistance, and Support levels.
EURUSD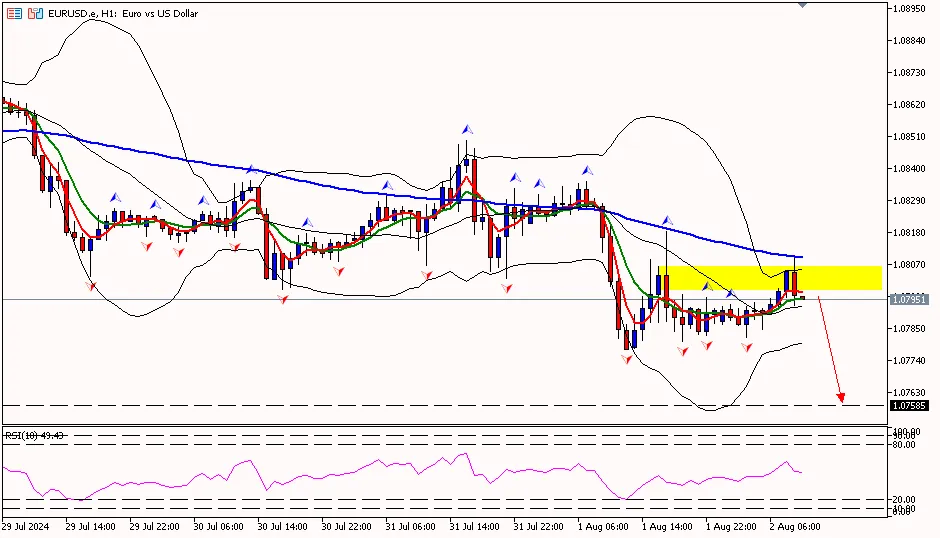
EUR/USD on the 1-hour timeframe is below the pivot area at 1.08060, attempting to move down toward the first support area at 1.07770 and then toward the second support at 1.07480. Meanwhile, the RSI indicator is below the pivot area, indicating that the euro has the potential to decline further.
Suggest: Sell 1.08060 TP1 1.07800 TP2 1.07600 SL 1.08260
|
PREVIOUS RANGE |
||||||
|
OPEN |
HIGH |
LOW |
CLOSE |
PREV.CLOSE |
CHANGE |
%CHANGE |
|
1.08212 |
1.08355 |
1.07776 |
1.07913 |
1.08259 |
-0.00346 |
-0.32% |
|
DAILY PIVOT POINT |
||||||
|
R3 |
R2 |
R1 |
PIVOT |
S1 |
S2 |
S3 |
|
1.08920 |
1.08640 |
1.08340 |
1.08060 |
1.07770 |
1.07480 |
1.07190 |
XAUUSD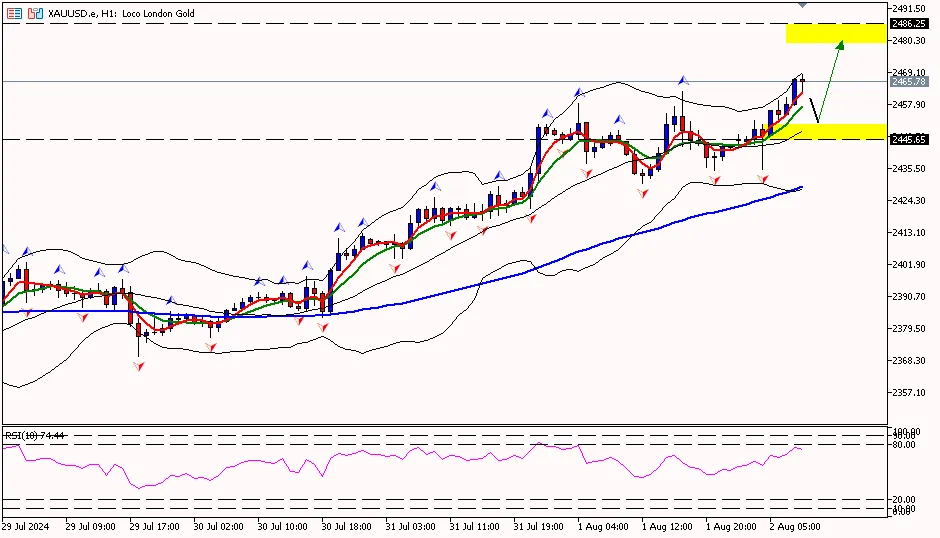
Gold prices on the 1-hour timeframe are above the first resistance area at 2462.00, attempting to move up toward the second resistance area at 2478.10 and then toward the third resistance area at 2494.00. Meanwhile, the RSI indicator is in the overbought zone above the pivot area, indicating that gold prices have the potential to move down first before continuing to rise.
Suggest: Sell 2466.00 TP1 2460.00 TP2 2450.00 SL 2471.00
|
PREVIOUS RANGE |
||||||
|
OPEN |
HIGH |
LOW |
CLOSE |
PREV.CLOSE |
CHANGE |
%CHANGE |
|
2448.88 |
2462.28 |
2430.24 |
2442.83 |
2447.61 |
-4.78 |
-0.20% |
|
DAILY PIVOT POINT |
||||||
|
R3 |
R2 |
R1 |
PIVOT |
S1 |
S2 |
S3 |
|
2494.00 |
2478.10 |
2462.00 |
2446.10 |
2429.90 |
2414.10 |
2397.90 |
CLSK (OIL)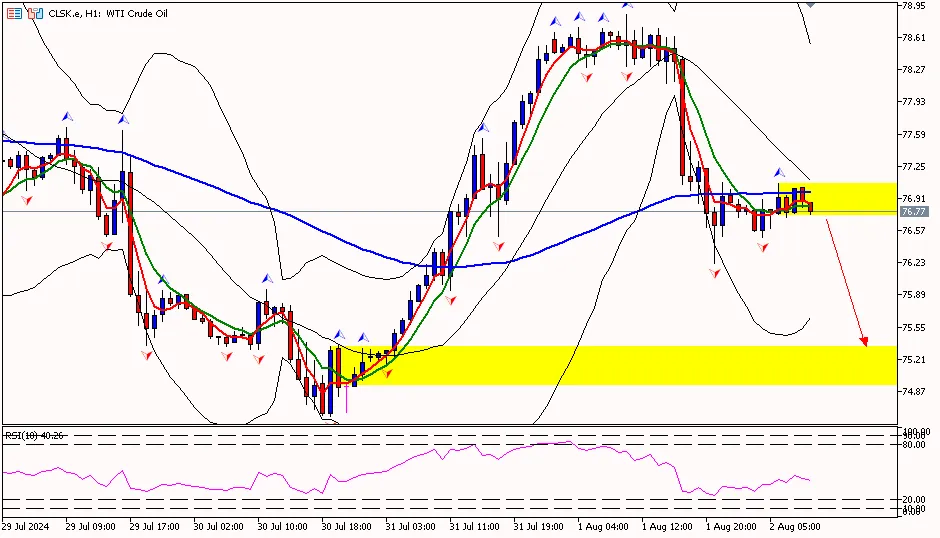
That concludes the explanation of "Daily Technical Analysis: August 2, 2024 – U.S. Labor Market Slows, Dollar Erodes." Also, check out our other articles, such as the explanation of how to buy cryptocurrency, only on the GIC Journal. Don’t forget to sharpen your trading skills by getting the Scalping Guide Ebook. Make sure to download the GIC Mobile App on Google Play Store.


